
The US Dollar Index (DXY) on Wednesday pulled back off the current weekly highs of about 90.85 to trade at around 90.60 after the latest round of US data. The USDX continues to trade in a highly volatile sideways channel in the 60-min chart.
The US dollar currency index is still pinned several levels above the 100-hour and the 200-hour SMA lines. Wednesday’s pullback pushed the dollar index from overbought levels of the 14-hour RSI back to the normal trading zone.
The US Dollar Index Fundamentals Overview

From a fundamental perspective, the US dollar index is trading at the back of a relatively busy period in the US market. On Wednesday, the US durable goods orders for December missed the expectation of 0.9% with a change of 0.2%. Nondefense capital goods orders came in line with the expected change of 0.6%, well below the previous period’s change of 1%. Durable goods orders ex-transportation outperformed the expected change of 05% with a change of 0.7%. The Federal Reserve Committee resolved to keep the based interest rate at 0.25% same as the previous period.
Earlier in the week, the US housing price index for November posted a change of 1% (MoM) compared to a change of 1.5% in the previous period. The S&P/Case-Shiller Home Price Indices for November outperformed the expected (YoY) change of 8.6% with a change of 9.1%. The Chicago Fed. National Activity Index for December posted a reading of 0.52 reflecting a significant improvement from the reading of 0.31 posted in the previous period.
The US Dollar Index Technical Analysis (the 60-min Chart)
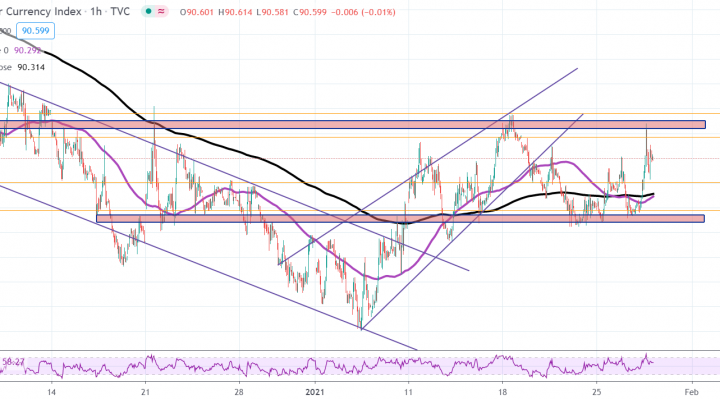
Technically, the US dollar index appears to be trading within a highly volatile sideways channel formation in the 60-min chart. The USDX has recently pulled back to return to the normal trading zone of the 14-hour RSI.
The bulls will be targeting short-term rebound profits at around 90.77 or higher at 90.96. On the other hand, the bears will look to pounce on pullback profits at around 90.40 or lower at 90.17.
The US Dollar Index Technical Analysis (the Daily Chart)
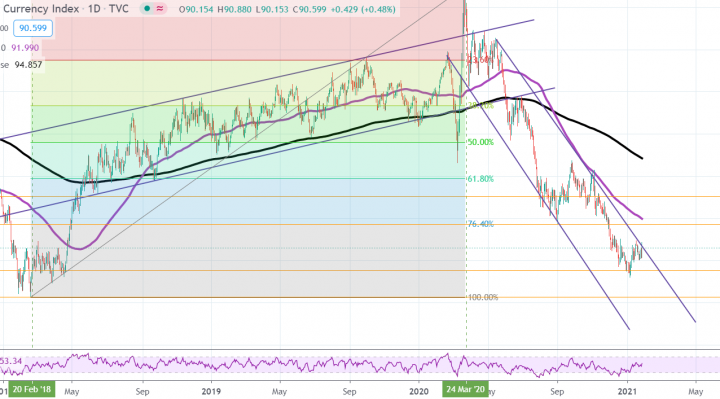
In the daily chart, the DXY appears to be trading within a sharply descending channel formation. This indicates a strong long-term bearish bias in the market sentiment. The USDX has recently bounced back to attempt a bullish breakout.
The bulls will be targeting long-term profits at around 91.73 or higher at 93.04. On the other hand, the bears will look to pounce on pullbacks at around 89.54 or lower at 88.26.