
USDCAD appears to be developing a potential head and shoulders reversal pattern on its recent price action, suggesting that the earlier uptrend from the 1.3600 lows could be losing momentum.
The currency pair has been consolidating around the 1.3820 level after failing to sustain gains above the pattern’s head formation near 1.3900.

The emerging head and shoulders structure shows a clear left shoulder formed in late July, followed by a higher peak (head) in mid-August, and what appears to be the right shoulder currently taking shape around similar levels to the initial shoulder.
This classic reversal pattern typically signals a shift in market sentiment from bullish to bearish once confirmed with a break below the neckline support.
The neckline of this potential formation appears to align with the ascending trend line that has been providing dynamic support since the July lows. This confluence zone sits near the 1.3750-1.3760 area, making it a critical level to watch for confirmation of the reversal pattern. A decisive break below this support could trigger a measured move lower equivalent to the height of the pattern.
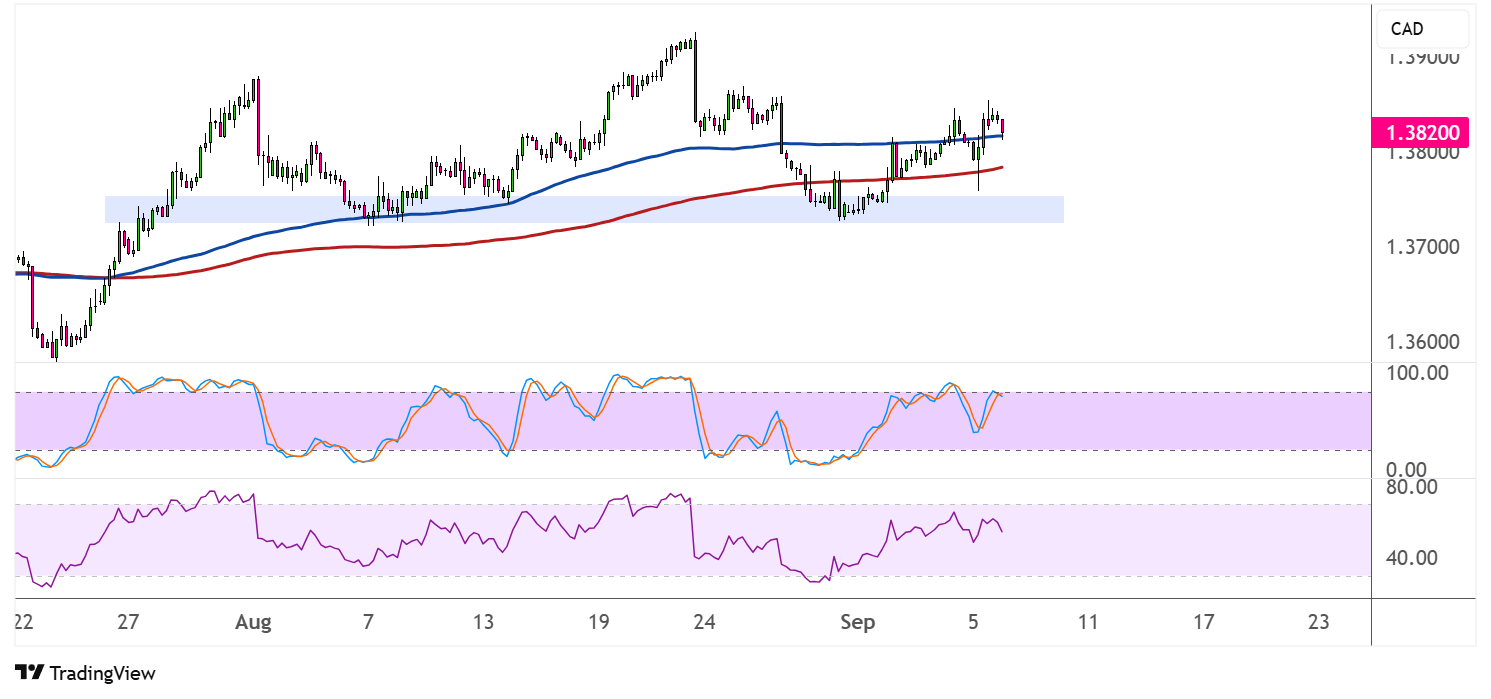
Moving averages are showing mixed signals, with the 100 SMA still above the 200 SMA, indicating that the longer-term bullish momentum remains intact for now. However, price action is hovering near both moving averages, suggesting that the trend could be at an inflection point.
Momentum oscillators are providing additional clues about the pair’s direction. The stochastic indicator has been oscillating in a sideways range, reflecting the current consolidation phase, while showing signs of potential bearish divergence with recent price highs.
Meanwhile, the RSI has declined from overbought levels and is currently testing the neutral 50 level, which often acts as a key support-resistance zone during trend transitions.
Should the head and shoulders pattern complete with a break below the neckline support, USDCAD could target the 1.3650-1.3700 area, representing a significant pullback from current levels and potentially signaling a broader trend reversal.