
USDJPY appears to be in a strong bearish phase, currently trading at 140.840 after breaking below a key support zone that had previously held firm. The pair has experienced significant downside momentum in recent weeks, suggesting a potential continuation of the downtrend.
Looking at the chart structure, USD/JPY has formed a series of lower highs and lower lows since early 2025, creating a head and shoulders pattern on its daily time frame. The price is now testing the neckline support level around 140.000, which if broken could pave the way for further declines toward the 135.000 handle.

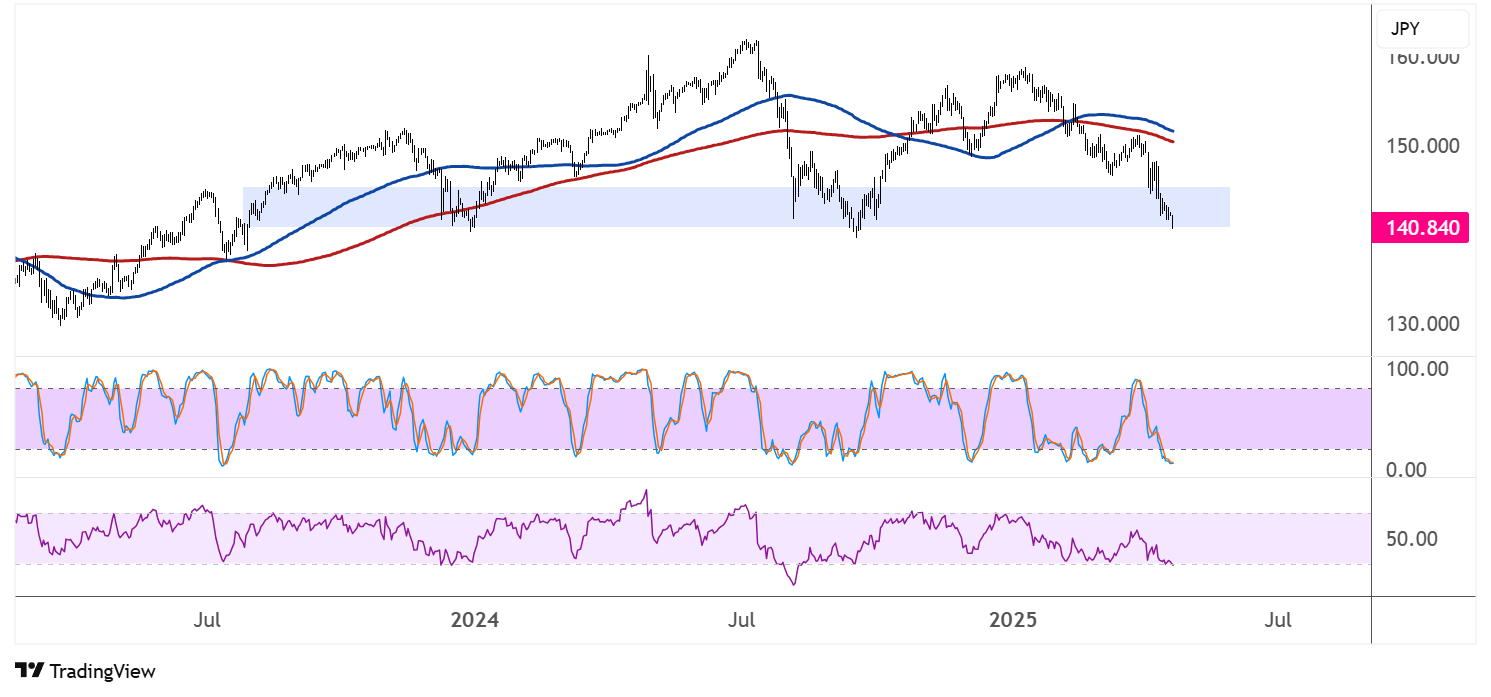
From a moving average perspective, both the 100 SMA (blue line) and 200 SMA (red line) are positioned above the current price action, with the 100 SMA above the 200 SMA. These appear to provide conflicting signals at the moment, although price being below both indicators could keep them holding as dynamic resistance.
The oscillators are providing additional confirmation of bearish momentum. The stochastic indicator (middle panel) has moved sharply lower and is approaching oversold territory, though it has not yet reached extreme levels. This suggests there could be room for further downside before a potential corrective bounce occurs.
Meanwhile, the RSI (bottom panel) is declining and currently sits around the 40 level, gradually approaching oversold conditions but not yet indicating exhaustion among sellers. The continued downward trajectory of the RSI reinforces the bearish bias in the near term.
A break below the neckline support could set off a drop that’s the same height as the chart formation, which spans approximately 2,000 pips. Souring sentiment for the U.S. economy as it continues to impose higher tariffs on its major trade partners are convincing investors to dump USD-denominated assets.
On the other hand, stronger than expected US data points could mean more upside for the currency, especially as other central banks revert to dovish policy biases.