
WTI crude oil has taken a sharp tumble but appears to be drawing support near the channel bottom around the $96.69 area, as the commodity continues to trade within a broader ascending channel formation.
The swift selloff has brought price all the way down to test the lower boundary of the channel, and the key question now is whether this floor can hold and send the energy commodity back toward its upside targets.

The Fibonacci extension tool highlights the levels where the next wave of buying interest could carry price. The 0.382 extension at $104.44 is the nearest upside target to watch, followed by the 0.5 level at $108.55 which lines up with a prior consolidation zone and could attract some profit-taking.
A stronger recovery could push WTI toward the 0.618 extension at $112.65, while a more sustained bullish run has its sights set on the 0.764 level at $117.72 near the channel top. The full 1.0 extension at $125.93 remains the longer-term objective if buyers can maintain control.
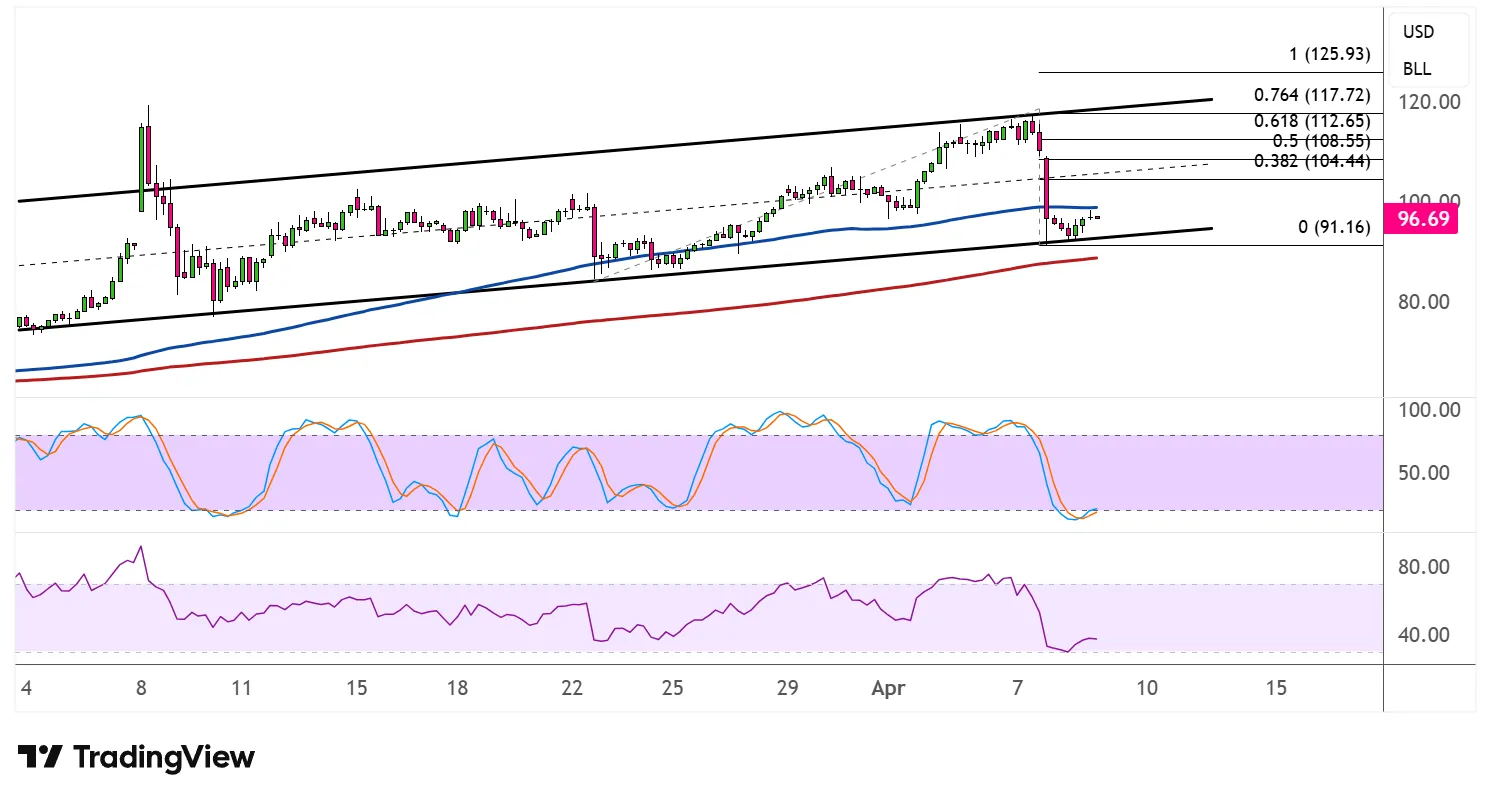
The 100 SMA (blue) is above the 200 SMA (red), confirming that the path of least resistance is still to the upside and that the broader climb is more likely to gain traction from here. Price has pulled back toward the 100 SMA, which could serve as dynamic support and help cushion further losses.
Stochastic has plunged deep into the oversold zone and appears to be attempting a crossover to the upside, suggesting that sellers may be running out of steam and that a bounce could be in the works. RSI has similarly dropped toward the oversold area and is showing early signs of turning higher, leaving plenty of room for a recovery move.
If the channel bottom and moving average support hold as a floor, WTI could resume its climb through the Fibonacci extension targets. A break below the 0.00% level at $91.16, however, would call the broader bullish structure into question.