
WTI crude oil has broken down from a symmetrical triangle formation on the short-term time frame, signaling that a bearish continuation could be in the works.
The measured move from the symmetrical triangle breakdown points to potential downside targets in the $60.00 area, with the next significant floor possibly found around $59.00–$60.00 per barrel. A deeper selloff could extend losses toward the $58.00 handle if bearish momentum picks up steam.

On the flip side, a recovery back inside the triangle could bring the $64.00 resistance level back into focus, near where the upper trendline and moving averages converge.
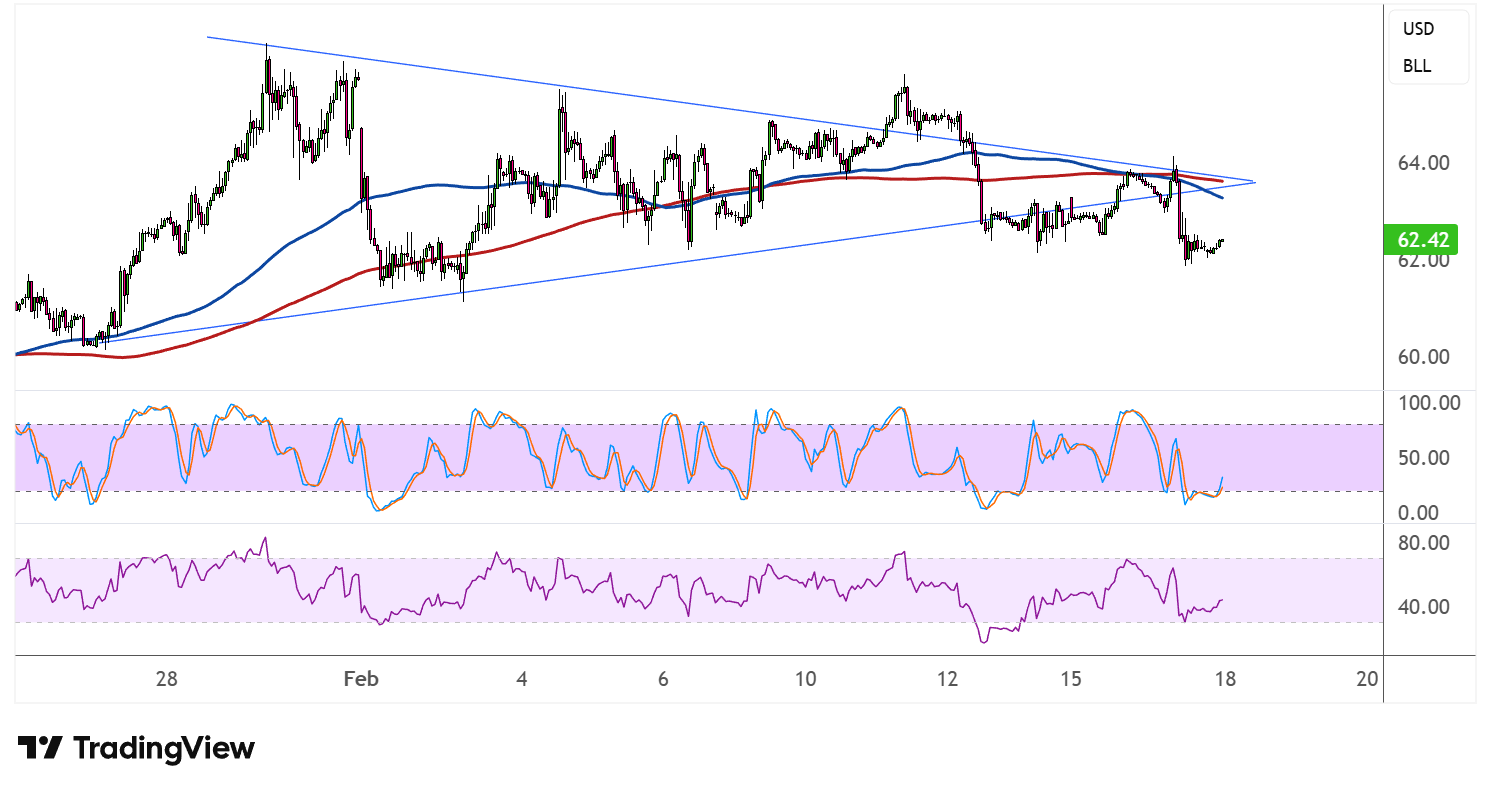
On the moving averages front, the 100 SMA (blue) has crossed below the 200 SMA (red) to confirm that the path of least resistance is now to the downside, or that the selloff is more likely to gain traction from here. Both indicators are hovering near the $63.50–$64.00 region and could serve as dynamic resistance on any attempted recovery.
Stochastic has been dipping in and out of oversold territory following the recent sharp drop, suggesting that selling pressure remains intense. A sustained move back above the oversold threshold without a meaningful price recovery would indicate that bears are firmly in control.
RSI has similarly pulled back toward the lower end of its range and appears to be stabilizing near the 40 level, though it has yet to signal a convincing reversal. Further downside in the RSI would align with continued price weakness.
Traders will be keeping a close eye on inventory reports and geopolitical developments, as any unexpected supply disruptions could provide crude oil with the catalyst it needs to recover lost ground. Reports that the US and Iran are closing in on a potential deal has meaningfully eased supply concerns in previous trading sessions, leading to sharp downside for the commodity.