
WTI crude oil has been trending lower within a descending channel on the short-term time frame, with price recently staging a recovery from the swing lows only to run into a familiar ceiling.
The commodity is currently testing the resistance at the falling trend line near the $93.45 area, raising the question of whether the bounce has run its course and sellers are ready to take the wheel again.

The Fibonacci extension tool shows where additional losses could unfold if the trend line holds as a ceiling. The 38.2% Fib is located at $89.48, which could be the first area of interest on the way down.
A deeper selloff could reach the 50% level at $87.18, followed by the 61.8% extension at $84.89. A more significant slide could eventually bring the 76.4% Fib at $82.05 or even the full extension target at $77.45 into play if bearish pressure intensifies.
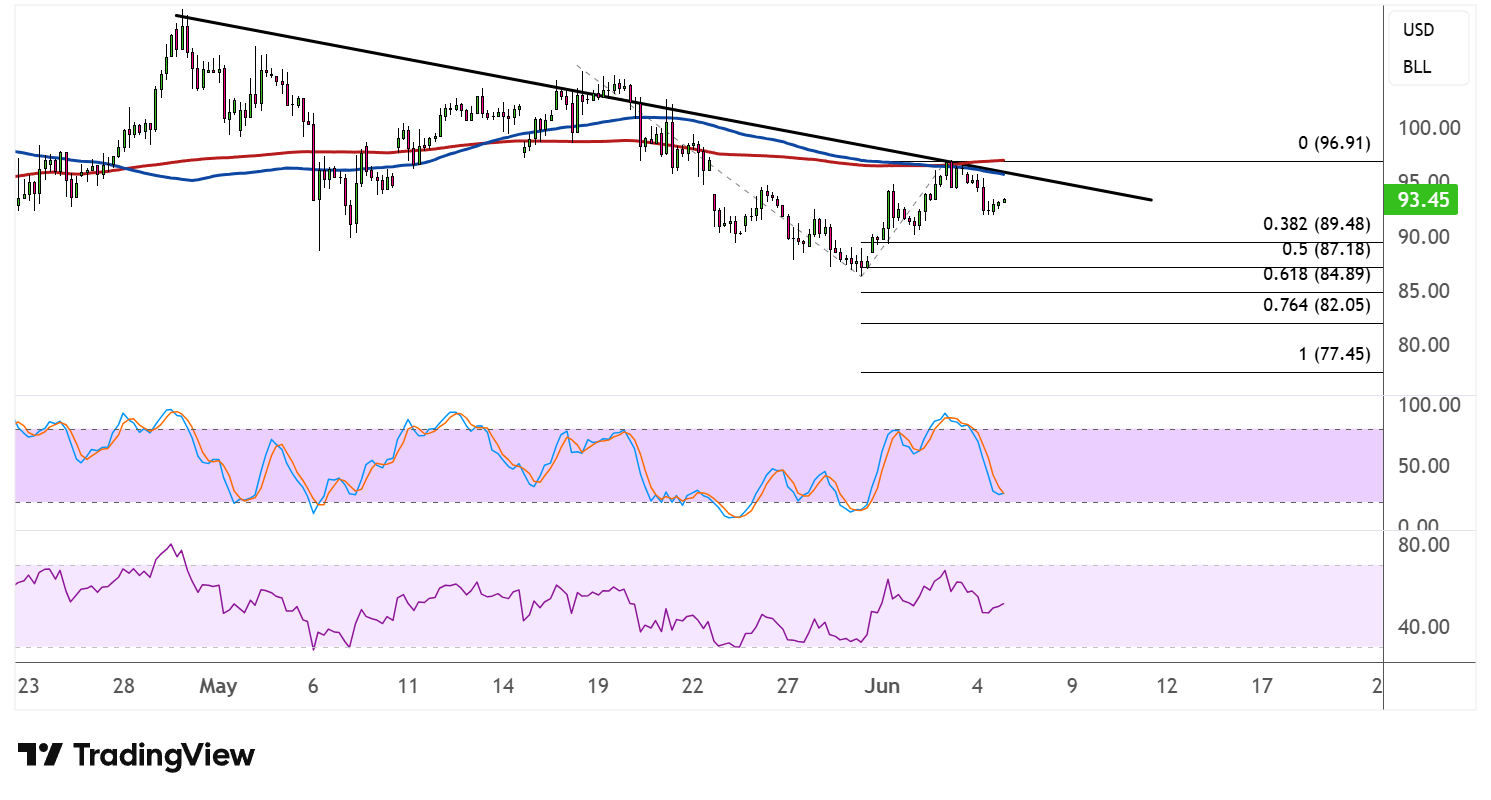
The 200 SMA is now above the 100 SMA, suggesting that the path of least resistance is to the downside or that the selloff is more likely to gain traction from here. Price is also struggling to reclaim either moving average, with the indicators converging near current levels and potentially acting as dynamic resistance on any further attempts to push higher.
Stochastic has just turned lower from the overbought zone, reflecting a return in selling pressure after the recent corrective bounce. The oscillator has plenty of room to slide before reaching oversold territory, which means downside momentum could persist for a while longer.
RSI, meanwhile, is also rolling over from elevated levels and has significant ground to cover before reaching the oversold area, suggesting that sellers could remain in control in the near term.
A clean rejection at the trend line would reinforce the bearish bias, while a decisive break above it could put the swing high at $96.91 back on the radar. Positive geopolitical developments surrounding the Israel-Lebanon ceasefire and potential US-Iran deal could mean more downside for oil as the war premium unwinds.