
The US dollar currency index on Thursday rallied to set a new multi-decade high of about 103.900 before pulling back late on to settle at about 103.557. The USDX continues to trade within an ascending channel formation in the 60-min chart after bouncing back on Wednesday.
The DXY remains above the 100-hour moving average line despite Thursday’s late pullback. However, it has now returned to the normal trading zone after drifting to overbought conditions.
The US Dollar Index Fundamentals Overview

From a fundamental perspective, the US dollar currency index is trading at the back of a relatively busy period in the US market. On Thursday, the initial jobless claims for the week ending April 29 missed the expected claim count of 184k with a higher tally of 200k. On the other hand, the continuing claims for the preceding week outperformed the forecasted tally of 1.4 million with a lower count of 1.384 million. The US ADP employment change for April also came short of 395k with a job count of 247k.
Elsewhere, the ISM Services PMI missed the expectation of 58.5 with 57.1. The supporting verticals ISM Services Employment Index and New Orders Index also came short of expectations, while the ISM Prices Paid beat 84.1 with 84.6. Earlier in the week, the ISM Manufacturing PMI for April failed to match the expectation of 57.6 with 55.4. All the member verticals including the ISM Manufacturing Employment Index, New Orders Index and Prices Paid also missed expectations. The Federal Reserve also raised the base interest rate to 1% from 0.5%.
The US Dollar Index Technical Analysis (the 60-min Chart)
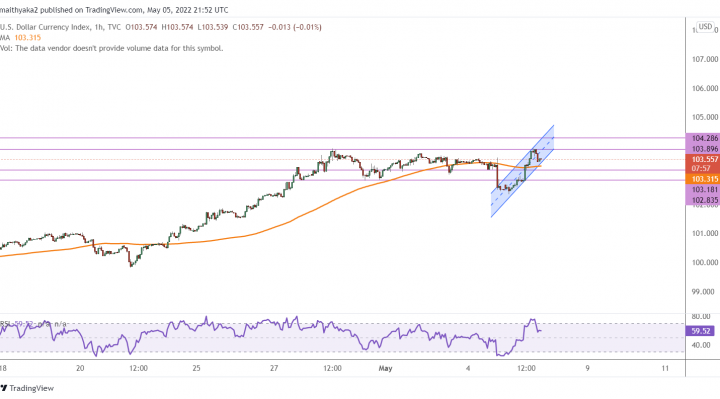
Technically, the US dollar Index seems to be trading within an ascending channel formation in the 60-min chart. This indicates a significant short-term bullish bias in the market sentiment.
Therefore, the bulls will be looking to ride the current bull trend by targeting profits at about 103.896, or higher at 104.286. On the other hand, the bears will be targeting potential pullbacks at about 103.181, or lower at 102.835.
The US Dollar Index Technical Analysis (the Daily Chart)
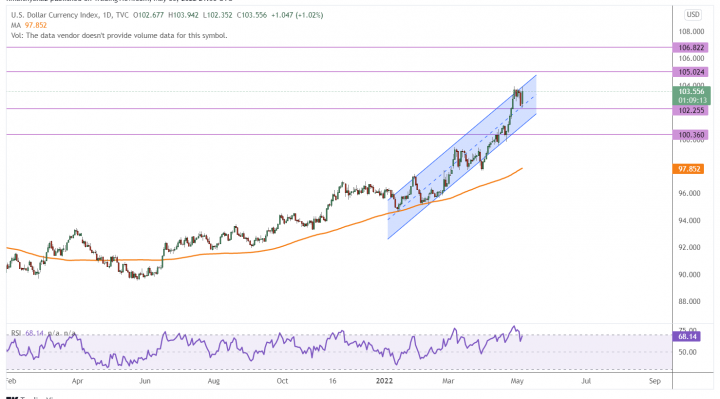
In the daily chart, the US dollar currency index also seems to be trading within a bullish trend formation despite the recent pullback. This indicates a strong long-term bullish bias in the market sentiment.
Therefore, the bulls will be targeting long-term profits at about 105.054, or higher at 106.822. On the other hand, the bears will look to pounce on potential reversals at about 102.255 or lower at 100.360.