
The GBP/USD currency pair on Friday pulled back from session highs of about 1.2210 before finding trendline support at about 1.2139. The currency pair appears to be trading within a highly volatile sideways channel formation after a recent pullback.
As a result, the currency pair has plummeted to trade several levels below the 100-hour moving average line in the 60-min chart. However, the recent rebound pushed the pair off oversold conditions back to the normal trading zone of the 14-hour RSI.
GBP/USD Fundamentals Overview

From a fundamental perspective, the GBP/USD currency pair is trading at the back of a relatively busy period in both markets. On Friday, the UK retail sales for November missed the (MoM) expectation of 0.3% with a change of -0.4%. The (YoY) equivalent also missed -5.6% with a change of -5.9%. On the other hand, retail sales ex-fuel missed the (MoM) and (YoY) expectations of 0.3% and -5.8% respectively with a change of -0.3% and -5.9%. Earlier in the week, the Bank of England raised the base interest rate by 50 basis points to 3.5% up from 3%, in line with expectations.
In the US, the preliminary S&P Global Manufacturing PMI for December missed the expectation of 47.7 with a reading of 46.2. The Services PMI also came short of the forecasted figure of 46.8 with 44.4. Earlier in the week, US retail sales control group for November missed the expected change of 0.3% with a change of -0.2%. On the other hand, general retail sales came short of the forecast of -0.1% with a change of -0.6% (MoM).
GBP/USD Technical Analysis (the 60-min Chart)
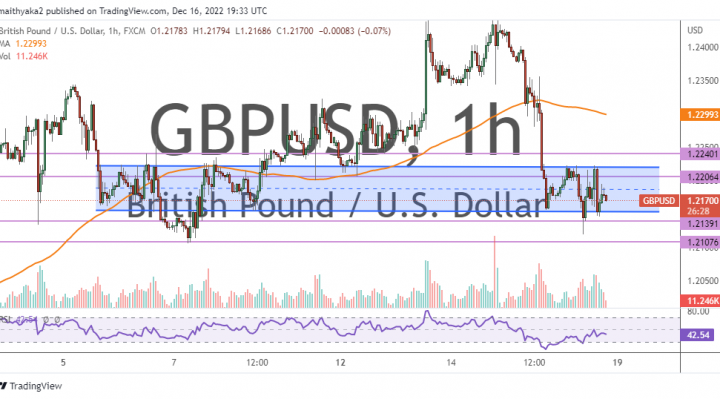
Technically, the GBP/USD currency pair seems to be trading within a highly volatile sideways channel formation in the 60-min chart. This indicates an intense battle between the bulls and the bears as they try to take control of the market.
Therefore, the bulls will be targeting short-term rebound profits at about 1.2206 or higher at 1.2240. On the other hand, the bears will look to pounce on profits at about 1.2139 or lower at 1.2107.
GBP/USD Technical Analysis (the Daily Chart)
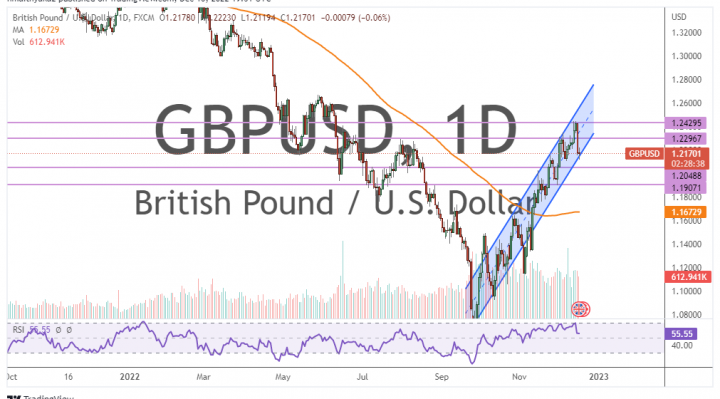
In the daily chart, the GBP/USD currency pair appears to be trading within an ascending channel formation. This indicates a significant long-term bullish bias in the market sentiment.
Therefore, the bulls will be looking to extend the current gains toward 1.2296 or higher to 1.2429. On the other hand, the bears will look to pounce on potential pullbacks at about 1.2048 or lower at 1.1907.