
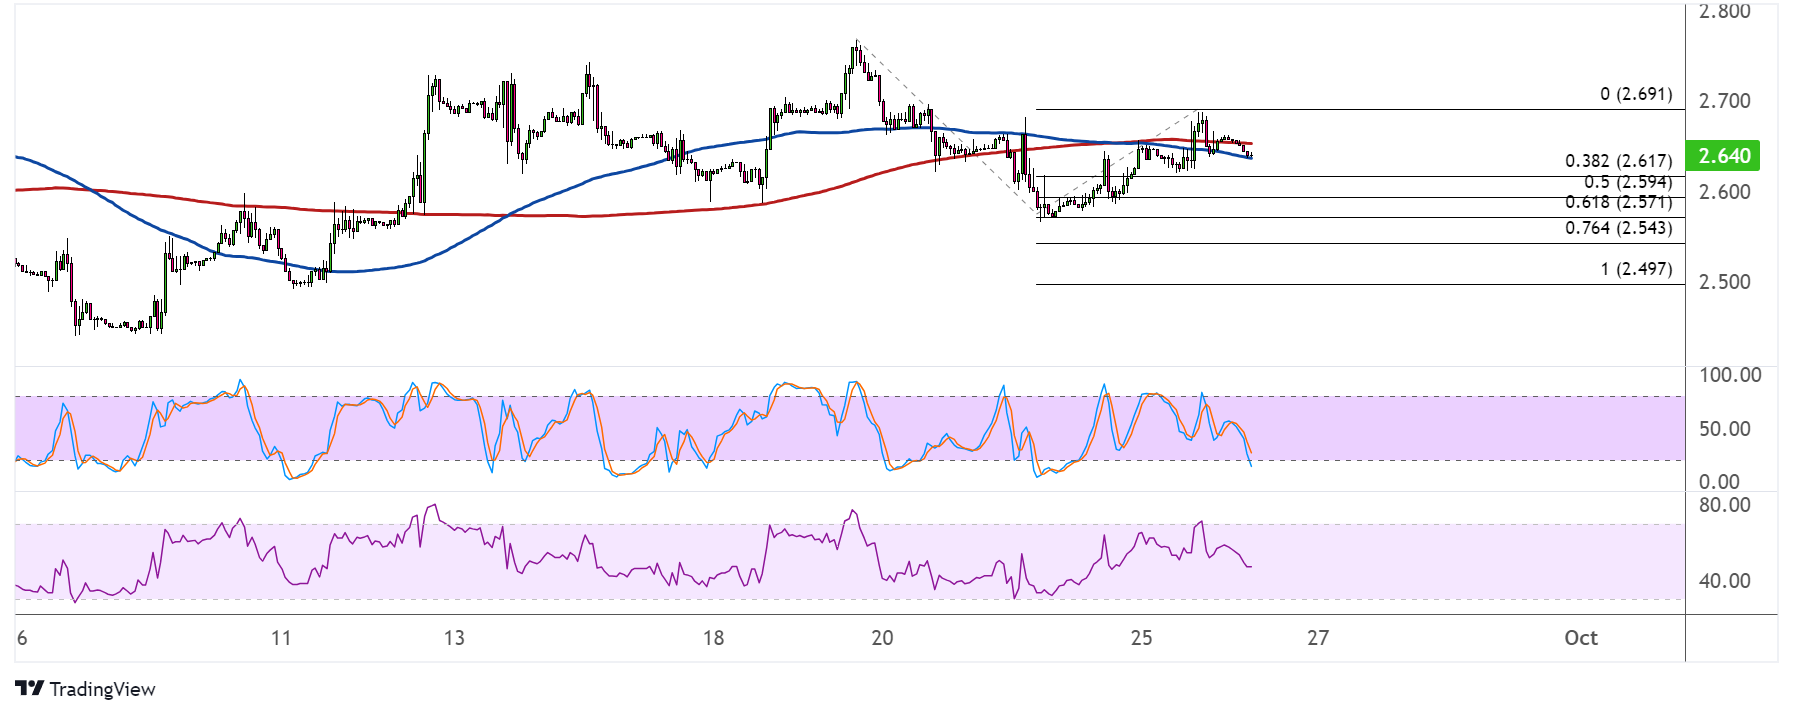
Natural gas seems to be completing its retest of the broken support zone around the $2.700 mark and might be setting its sights on the downside targets marked by the Fib extension tool.
The 38.2% level is at $2.617, then the 50% level is at $2.594. Stronger selling pressure could take it down to the 61.8% Fib at $.2571 near the swing low or the 76.4% extension at $2.543. The full extension is at $2.497 near the $2.500 major psychological mark.

The 100 SMA just crossed below the 200 SMA to confirm that the path of least resistance is to the downside or that the selloff is likely to resume. Natural gas seems to be finding dynamic resistance at the moving averages as well.
Stochastic is heading south to show that selling pressure is in play, and the oscillator has a bit more room to slide before reflecting oversold conditions. RSI is also moving down, so price could follow suit while bearish momentum is present. Turning higher, however, might signal a pickup in upside pressure.
Natural gas prices would likely take cues from the inventory data to be released by the Department of Energy. Confirmation that demand is slowing due to colder temperatures sapping demand for cooling commodities could mean more downside for prices.
On the other hand, indications that consumption remains elevated could bring some upside for natural gas prices in the near-term. Recall that the previous reporting week saw a larger than expected boost of 64 Bcf in stockpiles, so another larger build might be in the cards this time.
Commodity prices and other risk assets could also take directional cues from the US core PCE price index due later in the week, as this could support or negate Fed tightening expectations. Elevated inflationary pressures could mean more upside for the dollar since this would spark hopes of another 0.25% Fed hike.