
The Bitcoin price on Friday bounced off the current weekly lows of about $64,000 to trade at about $67,327 after the latest data. The BTC/USD trades within an ascending channel formation in the 60-minute chart.
The pioneer cryptocurrency has now advanced to trade a few levels above the 100-hour moving average line. Friday’s rally pushed the Bitcoin price closer to the overbought levels of the 14-hour RSI.
Bitcoin Price Fundamentals Overview

From a fundamental perspective, the BTC/USD trades during a relatively busy period in the US market. This week, the US Securities Exchange Commission (SEC) approved the trading of Spot Ethereum ETFs, with trading on the NYSE and CBOE beginning Tuesday. It is the second major cryptocurrency asset that traditional investors can now access via the exchange-traded funds market. This also paves the way for Solana ETFs with VanEck and 21Shares having already submitted their applications.
In the latest US economic data, the initial jobless claims for the week ending July 19 beat the expected claim count of 238k with a slightly lower tally of 235k. The durable goods orders for June missed the estimate of 0.3% with a change of -6.6%, while the durable goods orders ex-transportation outshone the estimate of 0.2% with a change of 0.5%. On the other hand, the nondefense capital goods orders ex-aircraft exceeded the forecast of 0.2% with a change of 1%.
Elsewhere, the preliminary US annualised gross domestic product for Q2 beat the expectation of 2% with a change of 2.8%, while the preliminary gross domestic product price index missed 2.6% with a change of 2.3%.
Bitcoin Price Technical Analysis (the 60-min Chart)
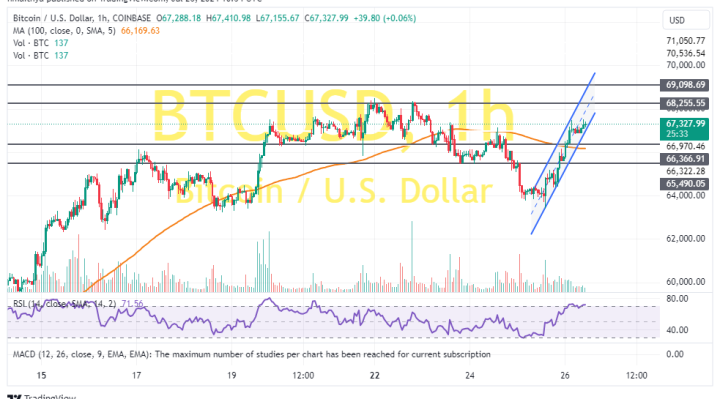
Technically, the BTC/USD trades within an ascending channel formation in the 60-minute chart. The 14-hour RSI has also ascended closer to the overbought levels, supporting a short-term bullish bias.
Therefore, the bulls will be targeting extended gains at about $68,255 or higher at $69,098. On the other hand, the bears will look to pounce on pullbacks at about $66,366 or lower at $65,490.
Bitcoin Price Technical Analysis (the Daily Chart)
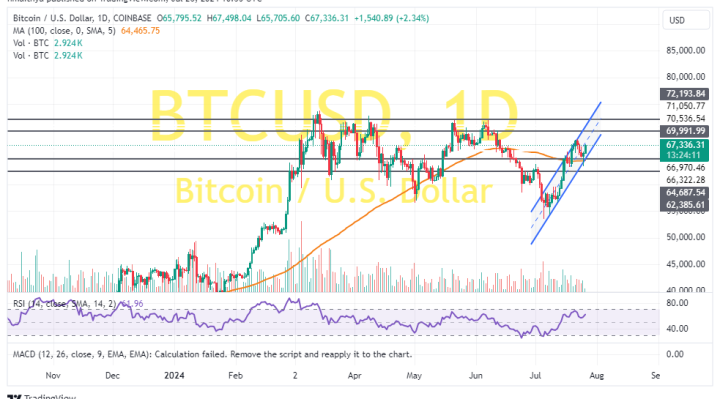
In the daily chart, the pioneer cryptocurrency also trades within an ascending channel formation. The 14-day RSI continues to support a bullish bias as it edges closer to overbought conditions.
Therefore, the bulls will be looking to ride the current rally towards $69,991 or higher to $72,193. On the other hand, the bears will look to pounce on profits at about $64,687 or lower at $62,385.