
Natural gas appears to be carving out an inverted head and shoulders pattern on the short-term time frame, hinting that a bullish reversal from the recent downtrend could be in the works.
Price is currently trading around $3.161, consolidating just below the pattern’s neckline resistance near the descending triangle top, and a confirmed break above this area could open the door for a significant leg higher.

If the neckline gives way, the measured move from the inverted head and shoulders formation projects an upside target in the $3.500 region, which also aligns with previous consolidation resistance. Beyond that, the 200 SMA looms as a major dynamic ceiling, currently sloping lower around the $4.000 area.
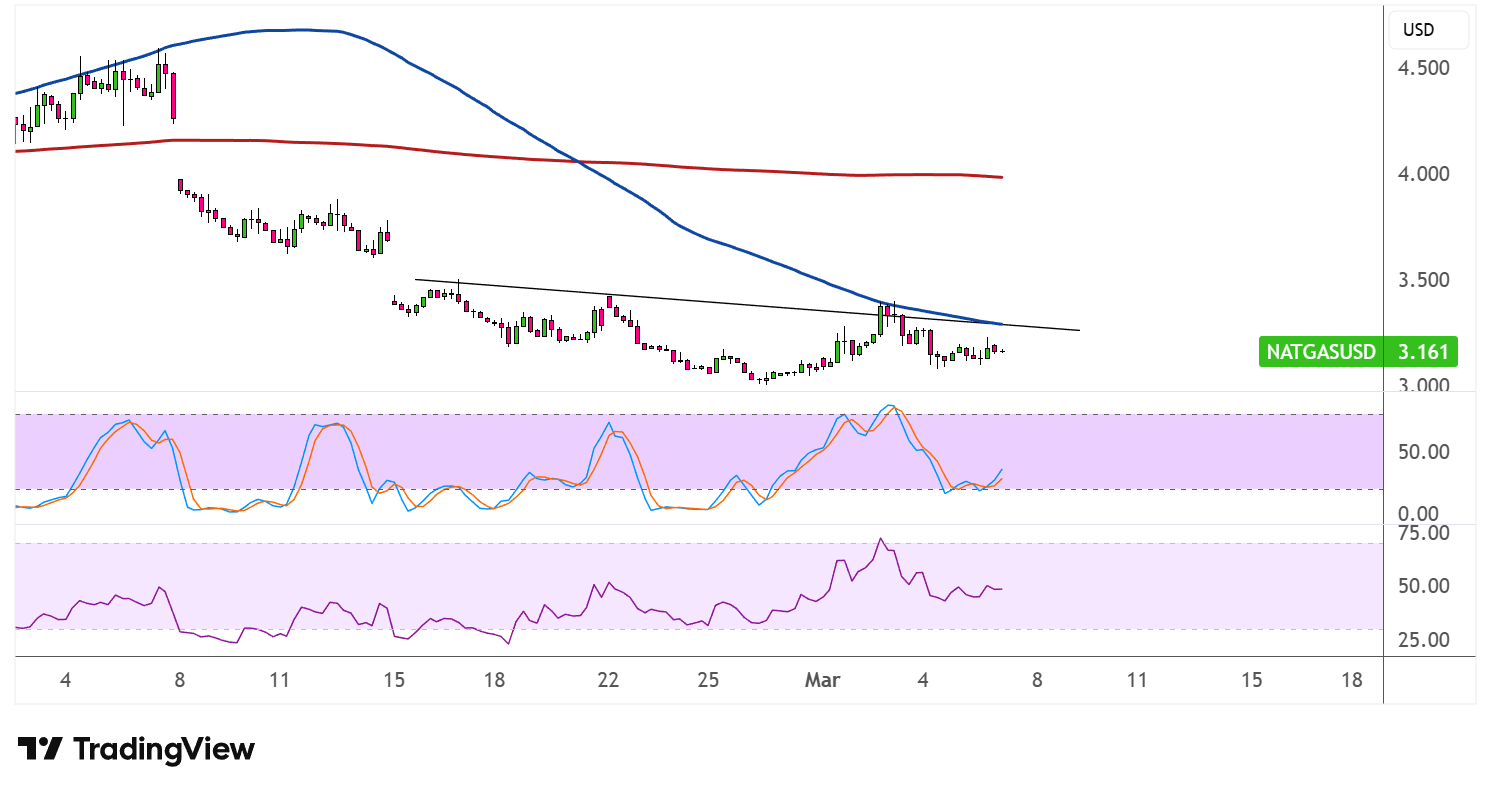
The 100 SMA remains below the 200 SMA, confirming that the broader path of least resistance is still to the downside. However, the 100 SMA is beginning to flatten, which could be an early sign that bearish momentum is losing steam.
Stochastic is turning higher from the midpoint area, suggesting that buyers are beginning to regain the upper hand. The oscillator has room to climb before reaching overbought territory, meaning bullish pressure could build further from here.
RSI is also pointing north from near the middle zone, leaving plenty of room to run before hitting overbought conditions. This alignment between both oscillators adds weight to the case for a potential upside break.
A confirmed close above the neckline on strong volume would likely attract momentum buyers and validate the inverted head and shoulders setup, potentially spurring a sustained recovery for natural gas.