
WTI crude oil appears to have carved out an inverted head and shoulders pattern on the four-hour time frame, with the left shoulder, head, and right shoulder forming around the $69.00 to $78.00 range over the past month.
Price has just broken above the descending neckline near the $80.00 mark, confirming a shift in trend from the preceding downtrend that began back in May.

Measuring the distance from the head’s low near $69.00 up to the neckline breakout point around $80.00 suggests a measured move objective in the vicinity of $91.00, which lines up with the broader resistance zone established back in early June. If the breakout holds, WTI crude oil could set its sights on this target in the sessions ahead.
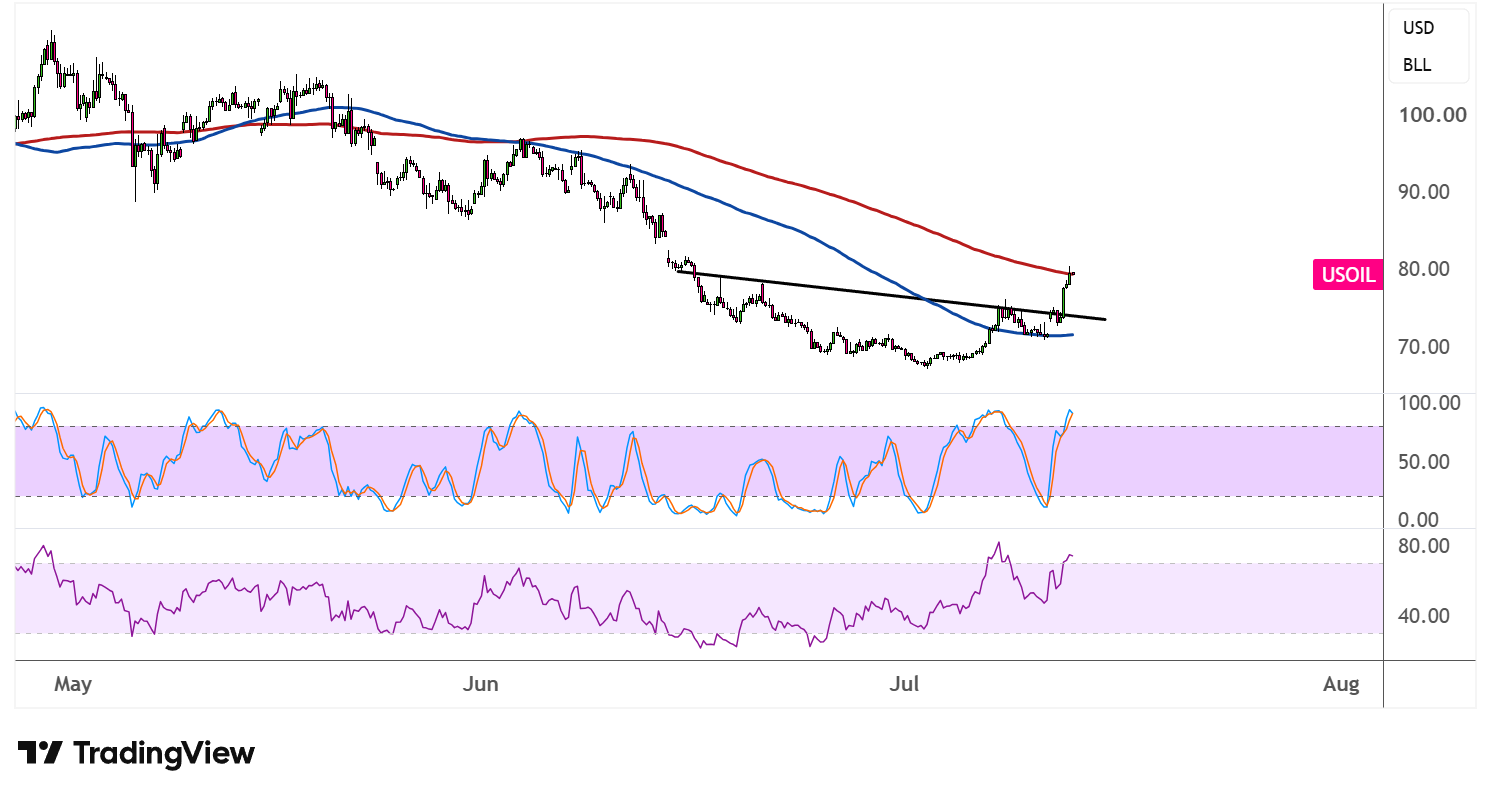
The 100 SMA is still below the 200 SMA, but the gap between the two has been narrowing sharply as price rallies off the pattern’s low, hinting that a bullish crossover could be in the cards if the current momentum is sustained. Price is also now trading above both moving averages, a shift that could allow these to serve as dynamic support on any pullbacks.
Stochastic has surged into the overbought zone, reflecting strong buying pressure behind the breakout, although this also raises the risk of a near-term pullback or consolidation before the climb resumes. A dip back toward the neckline, now potentially acting as support, could offer a fresh entry for bulls looking to ride the reversal.
RSI is also climbing sharply and approaching overbought territory, mirroring the bullish tone in the stochastic reading. As long as the oscillator keeps pushing higher without stalling, buyers are likely to remain in control.
Elevated geopolitical tensions in the Middle East, plus the reinstated US naval blockade on the Strait of Hormuz, could keep supply crunch fears in play and continue to trigger gains for crude oil.