
GBPCAD has been carving out a descending triangle since early July, with a series of lower highs connected by a falling trend line while a horizontal floor around 1.8726 has repeatedly held as support.
Price is currently edging lower within the pattern, trading near 1.8791 and closing in on this support once again. A test of the 1.8726 level could still spur a bounce, particularly if buyers step in to defend the same floor that has held on multiple occasions since mid-August.

If so, GBPCAD could work its way back up toward the 50% Fibonacci retracement of the latest leg down at 1.8793, an area price is hovering around already, before facing a tougher test at the 61.8% Fib near 1.8823 or the descending trend line resistance itself.
A break below 1.8726, on the other hand, could confirm a bearish resolution to the triangle and trigger a measured move selloff, with the height of the formation of roughly 340 pips projected lower to suggest a potential slide toward the 1.8380 area.
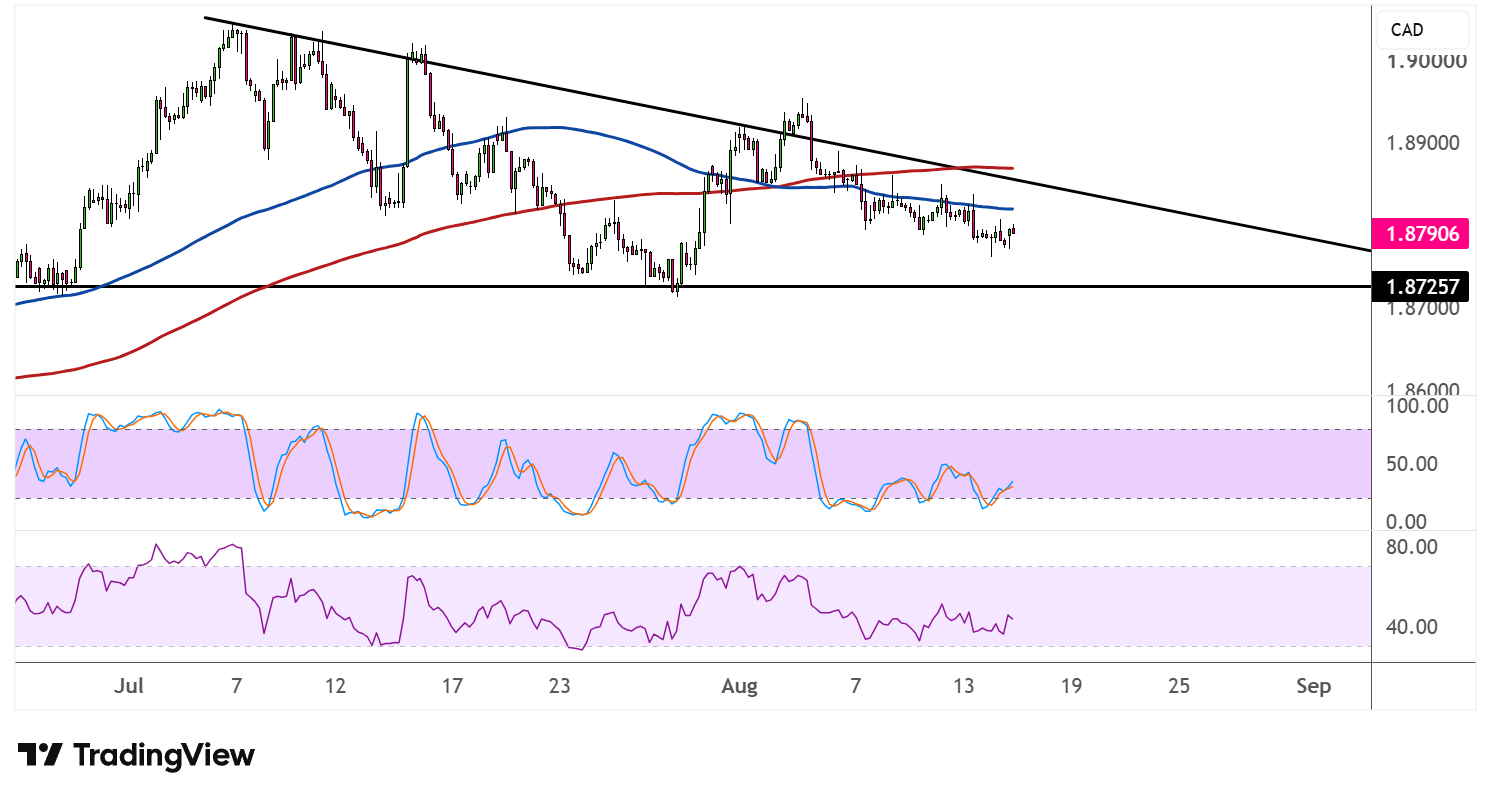
The 200 SMA has moved above the 100 SMA, with the gap between the two widening to reflect strengthening bearish pressure, while price is holding below both indicators, which could keep serving as dynamic resistance on any bounce attempts.
Stochastic is turning higher from a dip near the oversold zone, hinting that sellers may be running out of steam for now, although the oscillator still has room to climb before reaching overbought territory. RSI is also ticking up from the lower half of its range, suggesting a bit of near-term relief for the pound could be in the cards, even as the broader bearish structure remains intact.
Traders will likely keep an eye on how price behaves around the support line, as this could determine whether the triangle resolves with a bounce back toward resistance or a decisive breakdown.