
Natural gas appears to be carving out a double bottom chart pattern on the daily time frame, with both troughs finding support in the $2.650 region before buyers stepped back in.
Price has since climbed back toward the pattern’s neckline resistance near $2.850, an area also defined by a shorter-term ascending trend line connecting the swing lows since early August.

A decisive close above this neckline could confirm the reversal pattern and pave the way for a measured move rally, projecting a rise roughly equal to the formation’s height. This would put the next upside target somewhere in the $3.050 to $3.100 area, coinciding with the location of the 200 SMA dynamic resistance and not far from the swing highs traded back in late June and early July.
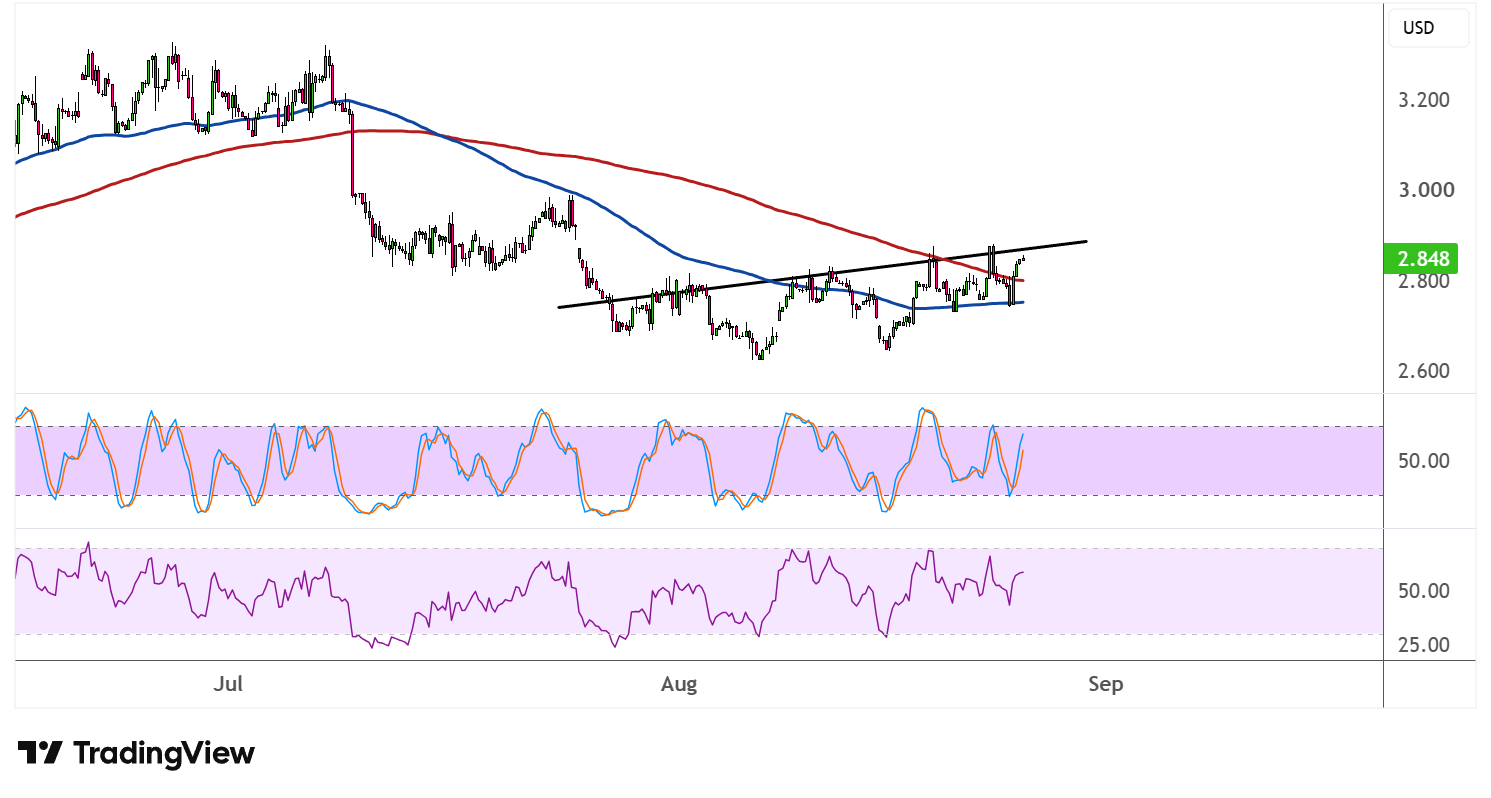
On the subject of moving averages, the 100 SMA is still located under the 200 SMA, reflecting the broader downtrend that has been in place since the sharp selloff in late June. However, the gap between the two lines has been narrowing steadily as the shorter-term average curls higher, hinting that a bullish crossover could be within reach if the breakout gains traction.
Stochastic is on the move up after cycling through the oversold zone, suggesting that bullish momentum is starting to build again, although the oscillator is nearing the overbought region, which could open the door to a bit of profit-taking before the climb resumes.
RSI, meanwhile, is also trending higher and has room to run before reaching overbought territory itself, so price could continue to track higher while buyers keep the upper hand.
Failure to clear the neckline, on the other hand, could keep gas confined to its recent range, with a slip back below the $2.650 double bottom lows negating the reversal setup and possibly setting off a fresh leg lower.
The upcoming US core PCE price index, second GDP estimate and Warsh’s Jackson Hole testimony could contribute to natural gas volatility before the end of the week.