
NZDUSD has been climbing steadily within a well-defined ascending channel since early August, with a series of higher highs and higher lows keeping the pair on a consistent uptrend.
Price recently tagged the channel’s upper boundary near 0.5988 before easing off, and the pair is now testing the area just below this ceiling.

The Fibonacci retracement tool shows where buyers could look to jump back in if the pullback deepens. The 38.2% Fib lines up at 0.5926, while the 50% level sits at 0.5907, close to the mid-channel area and a potential inflection point for the trend.
A deeper correction could reach the 61.8% Fib at 0.5887, which converges with the rising trend line and could be the line in the sand for a bullish pullback.
If any of these levels hold as a floor, NZDUSD could resume its climb toward the channel top and beyond, potentially setting new highs above 0.5988. A break below the channel’s lower boundary and the 61.8% Fib, on the other hand, could spell a larger correction back toward the 100 SMA dynamic support or lower.
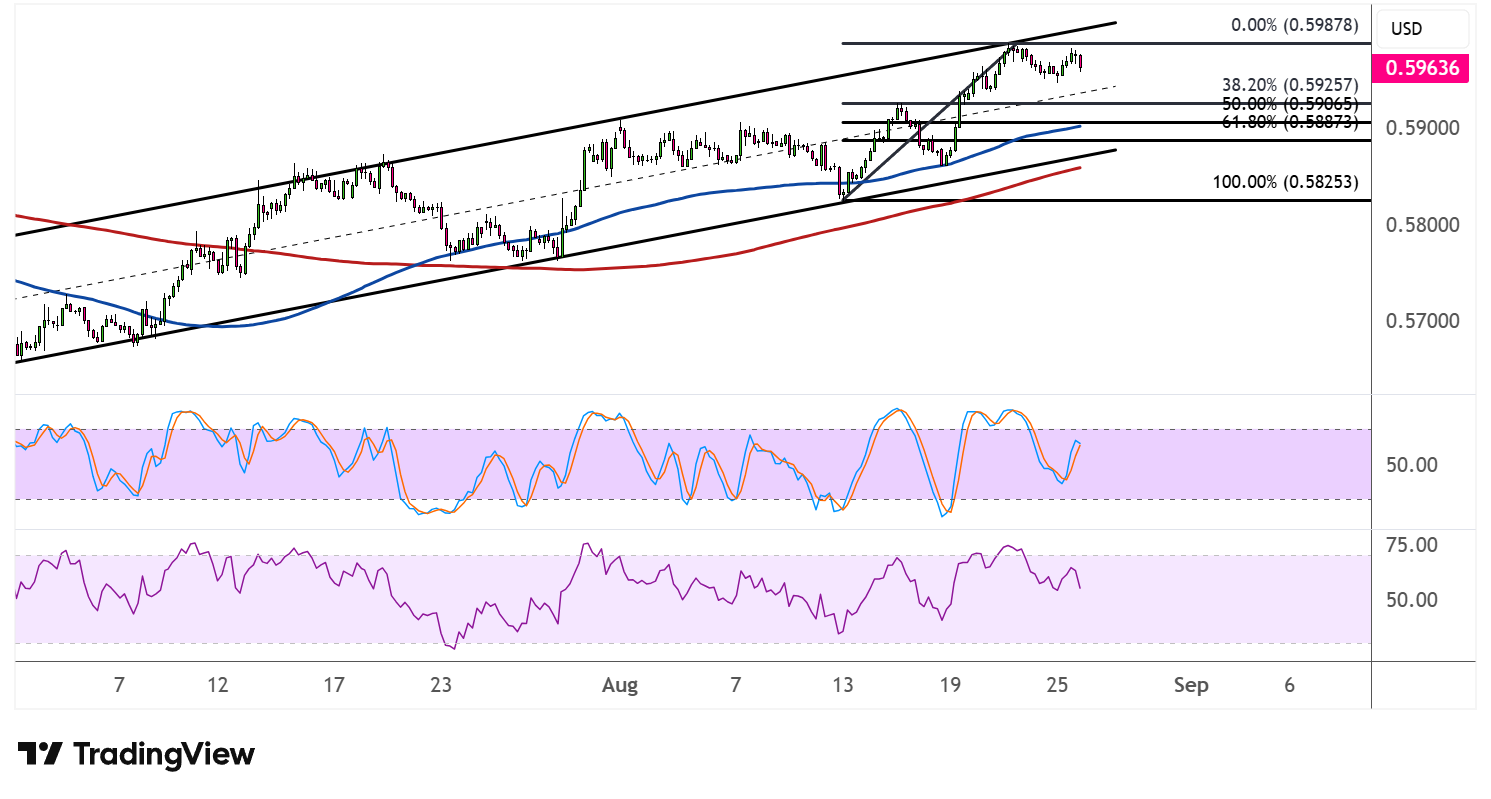
The 100 SMA is above the 200 SMA, confirming that the path of least resistance remains to the upside, and the gap between the two averages has been widening steadily to reflect strengthening bullish momentum.
Stochastic has pulled back from the overbought region and is curling lower, hinting that a bit more downside could unfold before buyers step back in. The oscillator still has room to fall before reaching oversold territory, so the pullback could persist a while longer.
RSI is also easing off from the overbought zone but remains above the 50.00 mark, keeping the broader bullish bias intact. As long as the oscillator holds above this threshold, dips could continue to attract buyers looking to ride the longer-term uptrend.
NZDUSD could take cues from Wednesday’s US core PCE price index, as well as Thursday’s second GDP revision, ahead of Fed head Warsh’s Jackson Hole testimony on Friday.