
Natural gas appears to have carved out a double bottom pattern on the daily time frame, with price forming two comparable lows near the $2.55–$2.60 region in recent months before staging a recovery.
This reversal pattern suggests that sellers may be losing steam after the broader downtrend that dragged price down from the highs above $5.000 earlier in the year.

Price is now working its way back up to test the neckline resistance around the $3.00–$3.15 area, which lines up with the shaded consolidation zone that capped rallies for much of the summer.
A clean break above this ceiling could pave the way for a measured move rally, as the height of the double bottom formation projects a potential target near $3.70 to $3.75 if bullish momentum carries through.
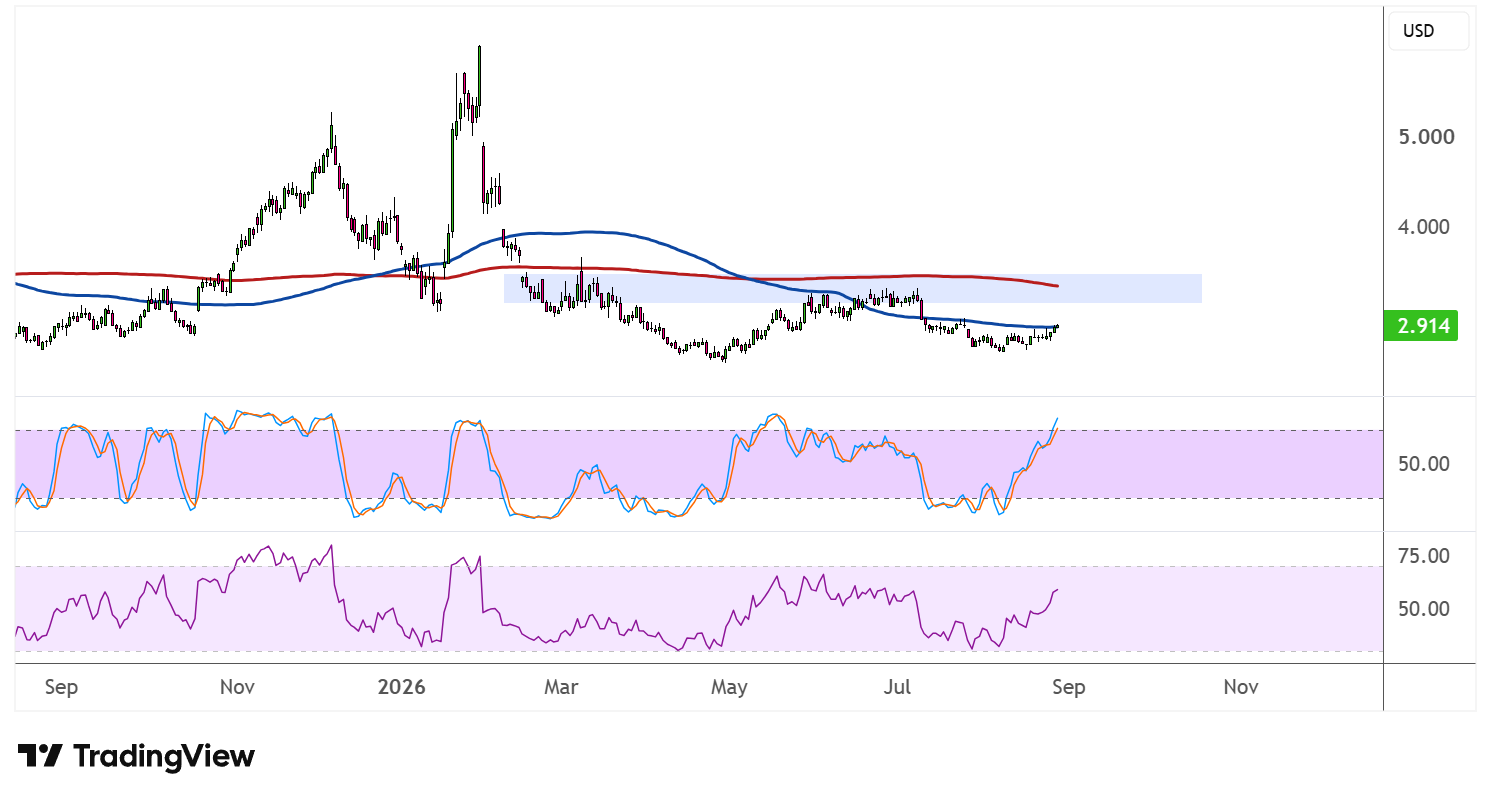
However, the 100 SMA is still below the 200 SMA, keeping the path of least resistance tilted to the downside on a longer-term basis. Both moving averages are converging near the neckline area, which could reinforce this zone as a dynamic ceiling and increase the odds of a bounce lower back toward the pattern lows if buyers fail to clear it decisively.
Stochastic has climbed sharply and is now approaching the overbought region, reflecting strong short-term bullish momentum but also raising the risk of a pullback once the oscillator tops out. RSI is also on the move higher, still with some room before reaching overbought territory, so price could continue to climb while buyers hold the upper hand.
Natural gas traders may want to keep an eye on weekly inventory data and shifting weather forecasts, as a larger-than-expected storage build could cap the rally near the neckline, while a bullish surprise could fuel the breakout needed to validate the double bottom pattern. Fed head Warsh’s first Jackson Hole testimony could also provide volatility and influence broader market sentiment.