
GBPCAD recently broke above the descending trend line resistance that had been capping price action since early July, confirming a shift in short-term momentum after weeks of consolidation within the broader triangle pattern.
Price rallied to a swing high near 1.8913 before pulling back to retest the breakout zone, which now lines up with a cluster of Fibonacci retracement levels that could serve as a floor for the bullish move.

The 38.2% Fib is at 1.8849, with the 50% level just below at 1.8829 and the 61.8% Fib at 1.8809, all converging near the former trend line resistance turned support. If this area is able to hold, GBPCAD could resume its climb toward the recent highs at 1.8913 or higher.
A deeper retracement back to the 100% Fib at 1.8745 would put the pair at the base of the triangle, which could be the line in the sand for the bullish scenario.
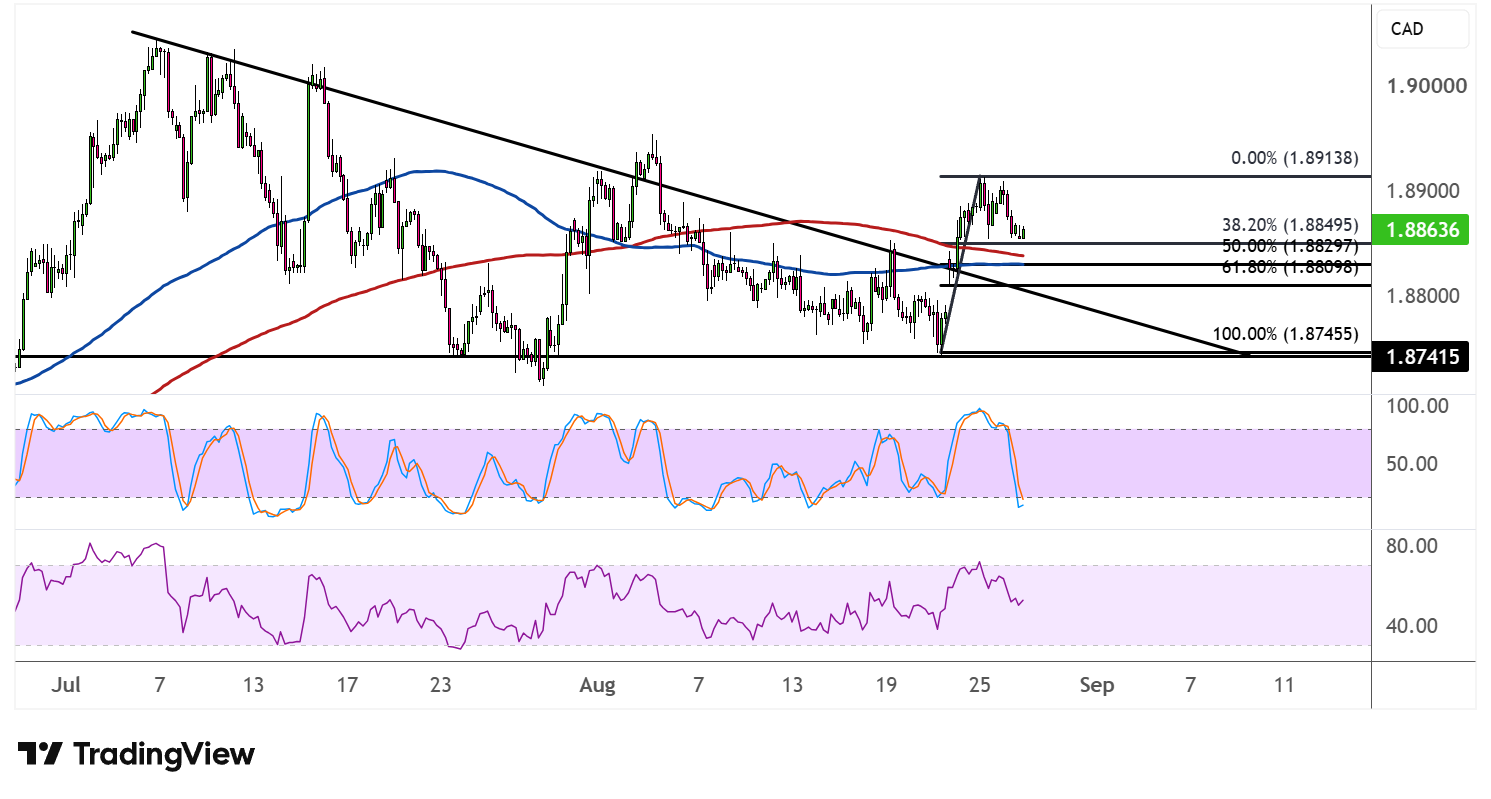
The 100 SMA is still below the 200 SMA, keeping the path of least resistance somewhat tilted to the downside on a longer-term basis, although the gap between the indicators has been narrowing as the pair climbs. Price is also trading above both moving averages, which could reinforce this zone as dynamic support on dips.
Stochastic has slipped from the overbought region and is heading lower, reflecting the recent pullback in price, though the oscillator still has room to fall before reaching oversold territory. RSI has also turned down from the top of its range, with some ground left to cover on the downside, so price could keep consolidating while buyers wait for a better entry.
A bounce off the Fibonacci confluence zone accompanied by bullish reversal candlesticks could be the trigger needed to sustain the breakout, while a slide below 1.8745 would raise the risk of the triangle pattern failing and price returning to its prior range.