
WTI crude oil is consolidating in a symmetrical triangle pattern after topping out around the $88.50 mark, with the converging trend lines pointing to a period of indecision as buyers and sellers duke it out around the $81.00 handle.
The Fibonacci retracement tool drawn from the swing low to the recent high shows where dip buyers could step back in. The 38.2% level lines up at $83.08, while the 50% Fib is right around current price at $81.40, which also converges with the 100 SMA to reinforce this zone as potential support.

A deeper pullback could reach the 61.8% Fib at $79.73, close to where the lower triangle trend line and 200 SMA are also converging, which could be the line in the sand for the correction to hold.
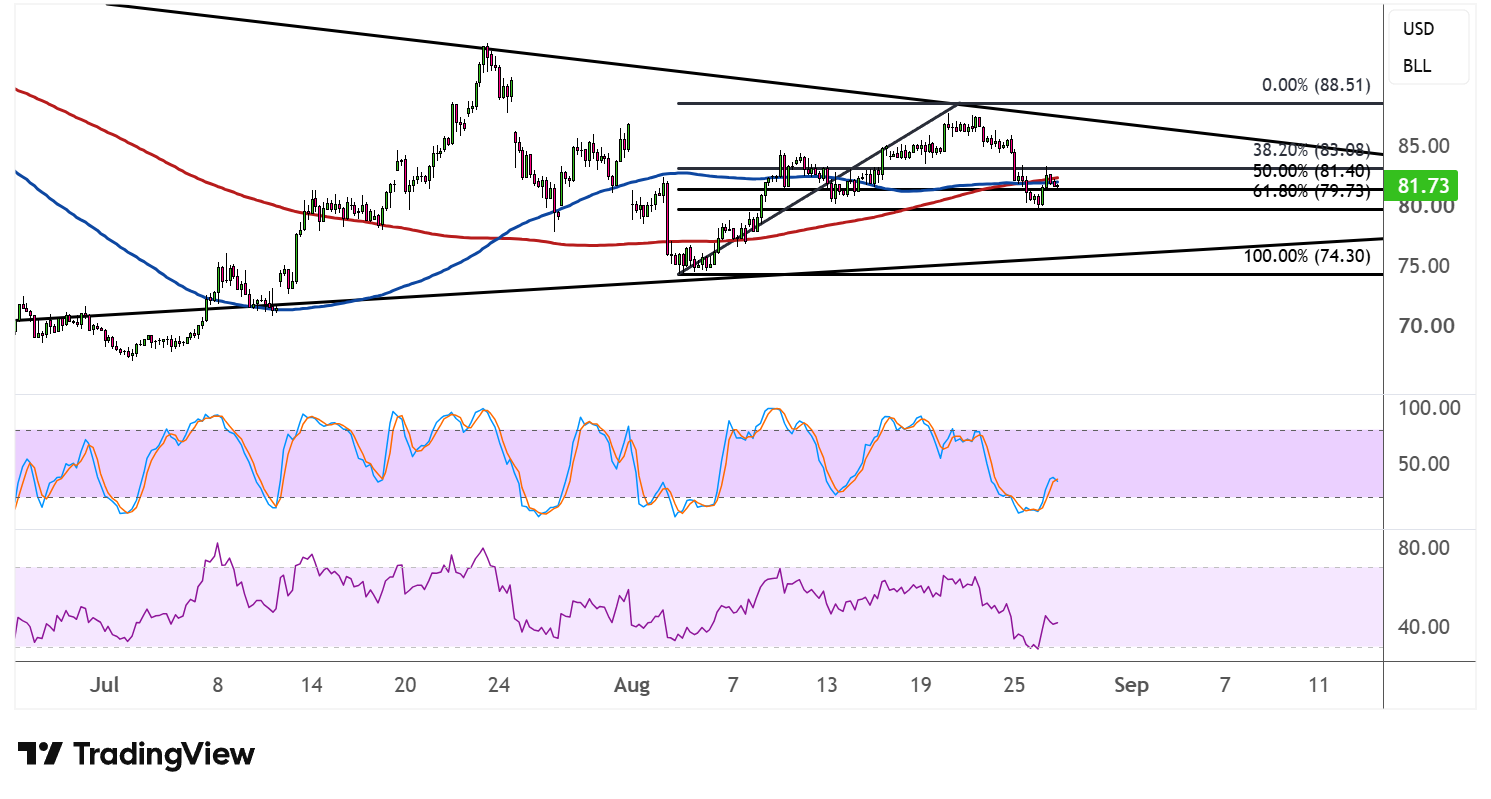
The 100 SMA is still above the 200 SMA, keeping the path of least resistance tilted to the upside for now, even with the latest pullback in price. If any of the Fib levels are able to keep losses in check, WTI crude oil could resume its climb back to the triangle top or higher.
Stochastic has already made its way down from the overbought zone and is nearing oversold territory, suggesting that sellers could be running out of steam soon. RSI is also on a steady slide, with some room left before reaching oversold levels, so price could keep drifting lower while sellers remain in control in the short term.
Traders may want to watch for a reversal candlestick pattern near any of these Fibonacci support levels, as this could be the trigger for a bounce back toward the upper triangle boundary and a resumption of the broader uptrend.
Rumors of a US-Iran deal on account of a peace agreement being brokered by Pakistan appear to be keeping cautious optimism about the Hormuz standoff in play, easing global oil supply concerns.