
USDX (USD Index)
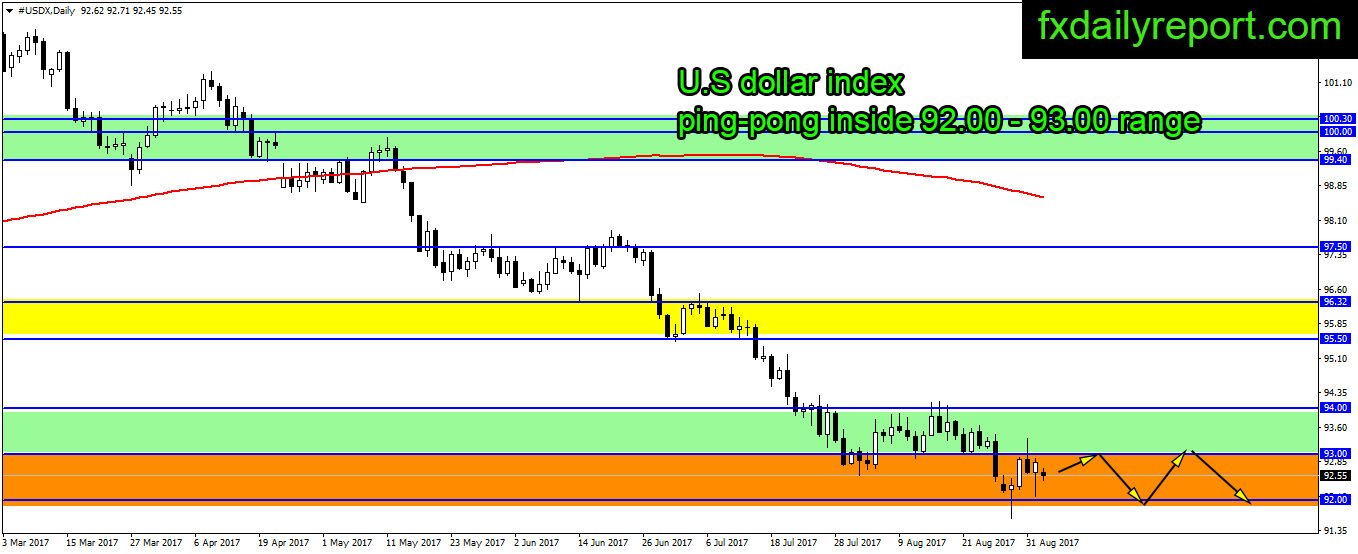
U.S dollar index shows bullish prospect in the previous week after North Korea risk abated. Unfortunately, over the weekend, the world once again saw North Korea launch another nuclear test. U.S dollar index opened lower on Monday and moving sideway. Overall, the index stuck between 92.00 – 93.00 area and risked further downside if no close above 93.00 happens soon.

The index expected to continue moving sideway today as U.S market is under labor day holiday.
News to watch
For full outlook for this week, you can follow Forex Outlook For The Week 4 – 8 Sep 2017
Technical Analysis
EUR/USD
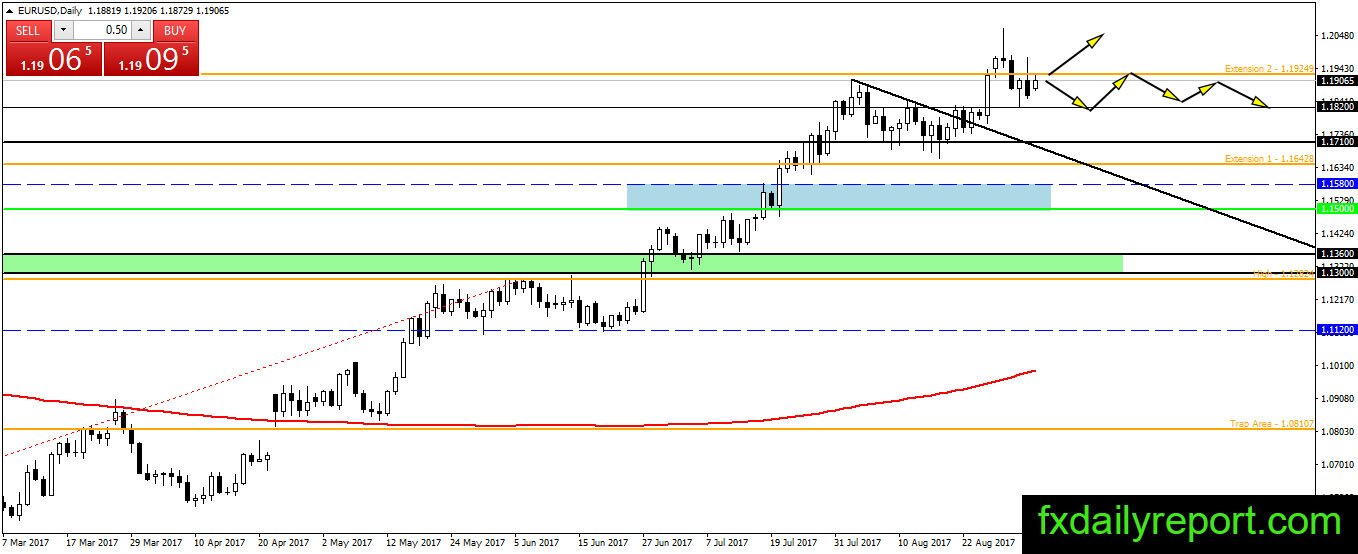
EUR/USD whipsaw happen at 1.1925 resistance level. The pair closed as bearish candlestick after worse than expected Non-farm employment result. The bull still holding ground today as fear shot up following North Korea nuclear test. As long as 1.1925 not broken, EUR/USD expected to continue moving inside 1.1820 – 1.1925.
Today critical level to watch:
Support: 1.1820, 1.1800, 1.1820, 1.1710
Resistance: 1.1900, 1.1924, 1.2000
GBP/USD
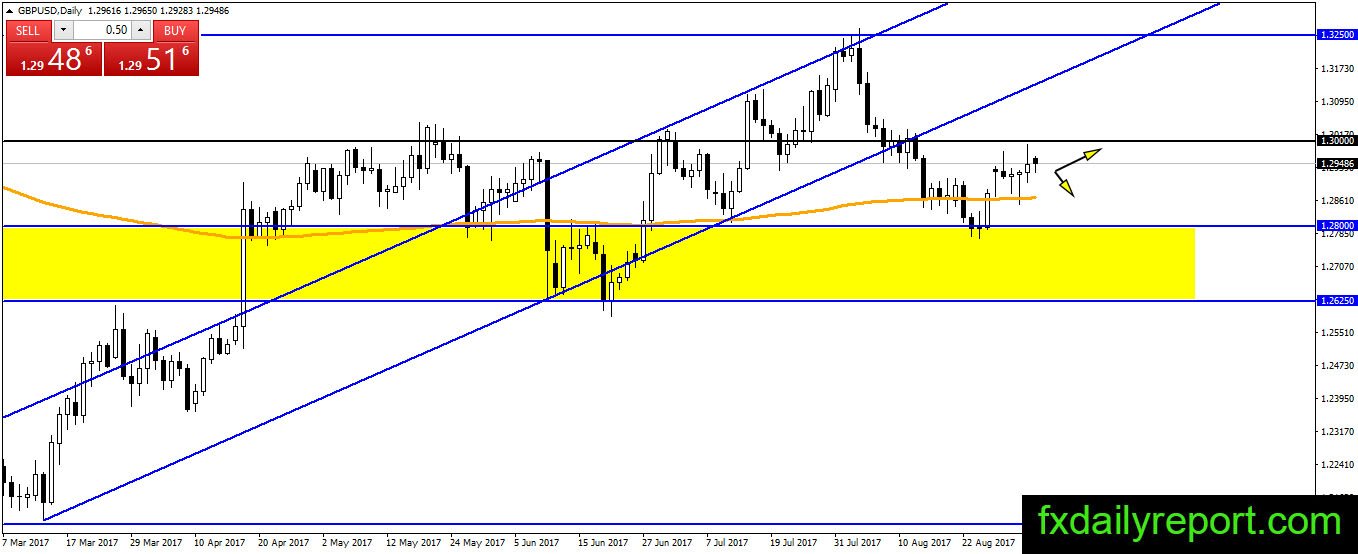
There is not much to write on GBP/USD after the pair reaches 1.3000. Currently, it is floating in the middle of daily SMA 200 and 1.3000. The pair might not move much until next week monetary policy release.
Today critical level to watch:
Support: 1.2930, 1.2900, 1.2870, 1.2800, 1.2700
Resistance: 1.3000, 1.3070
USD/JPY
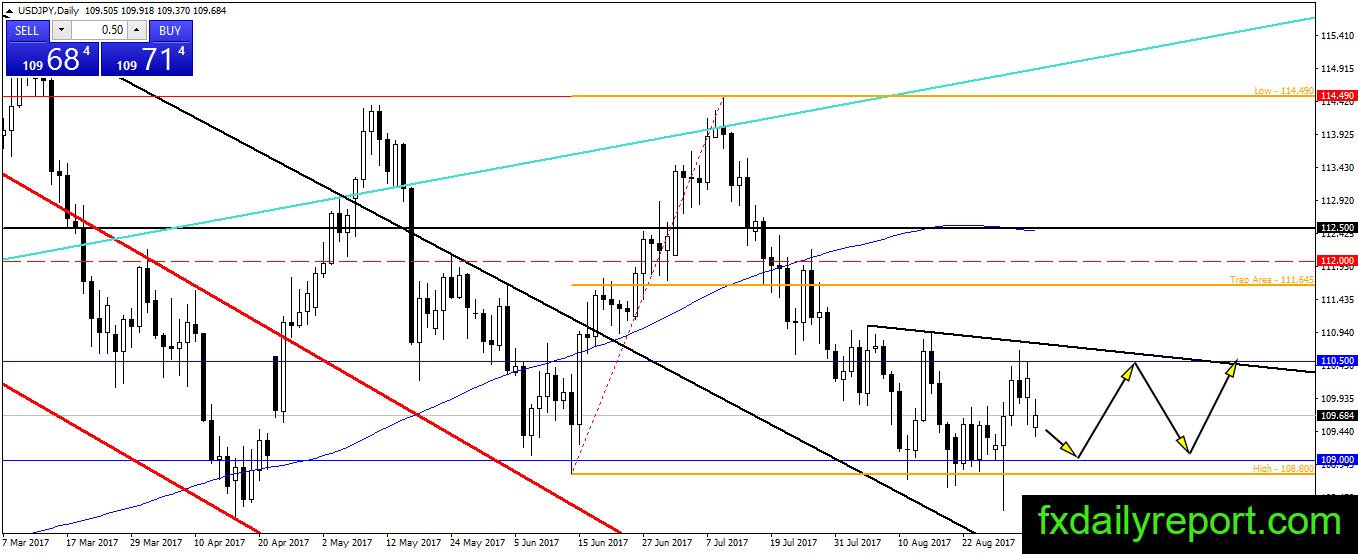
USD/JPY is lower after 110.50 rejection, the price open gapped down today on North Korea risk. It is possible for the pair to continue lower and test 109.00. Will we see another bounce from the support or a sharp break lower below the 29th August bullish candlestick?
Today critical level to watch:
Support: 109.00, 108.10
Resistance: 110.00, 110.50, 110.94, 111.00
AUD/USD
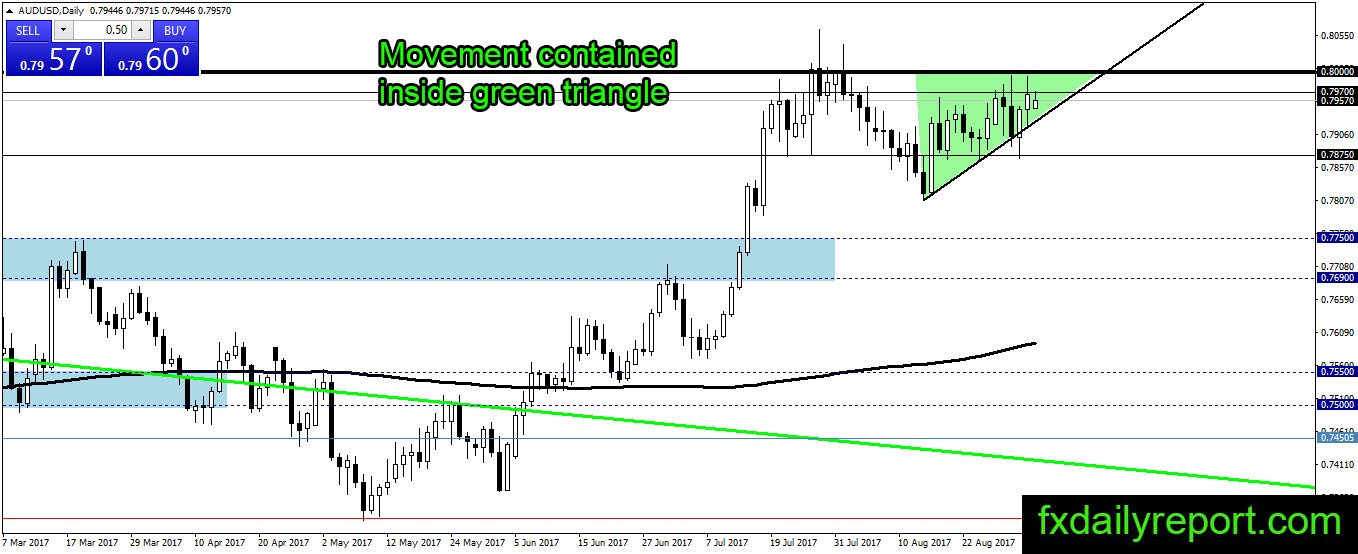
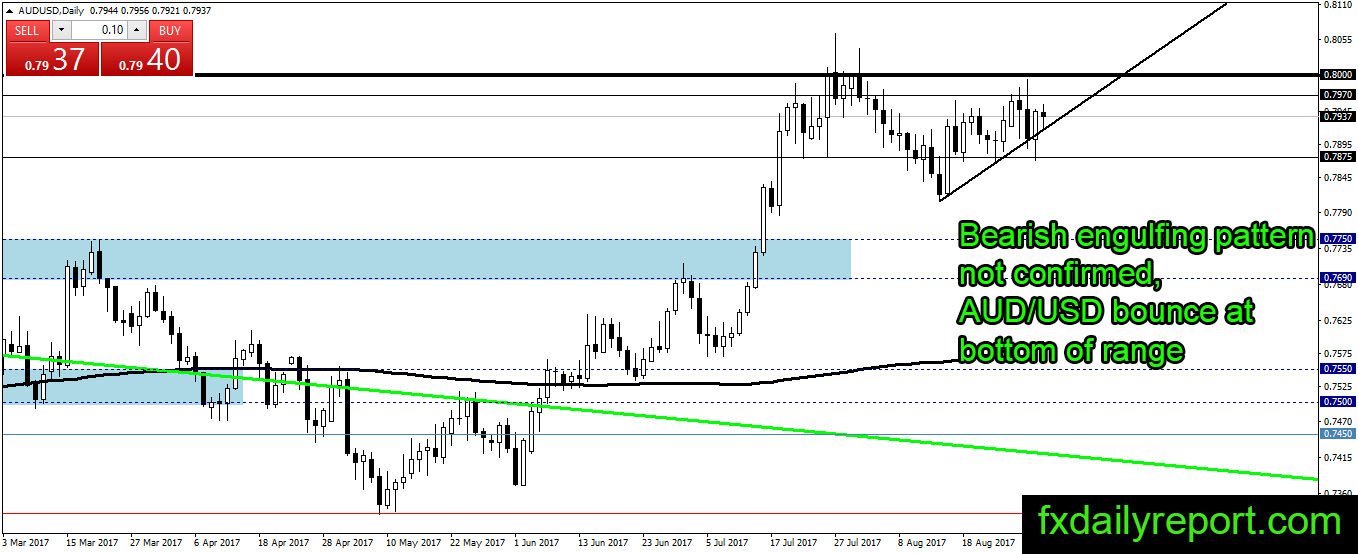
AUD/USD same level and same outlook as the previous week. The pair is initially moving inside 0.7850 – 0.7970 range, but the bull is slowly gaining the upper hand and drive the pair inside green triangle range. This is an ascending triangle pattern which has better odds breaking upside. Meanwhile, traders could stay sideline or trade the triangle range until it breaks.
Today critical level to watch:
Support: 0.7900, 0.7875, 0.7834, 0.7750
Resistance: 0.7970, 0.8000