
The US Dollar (USD) inched higher against the Japanese Yen (JPY) on Tuesday, increasing the price of USDJPY to more than 110.50 amid some key economic releases. The technical bias remains bearish because of a lower high in the recent upside move.
Technical Analysis

As of this writing, the USDJPY pair is being traded around 110.87. A hurdle may be noticed near 110.92, an immediate trendline resistance area ahead of 111.00, the psychological number and then 111.39, the high of the last major upside rally as demonstrated in the given below daily chart.
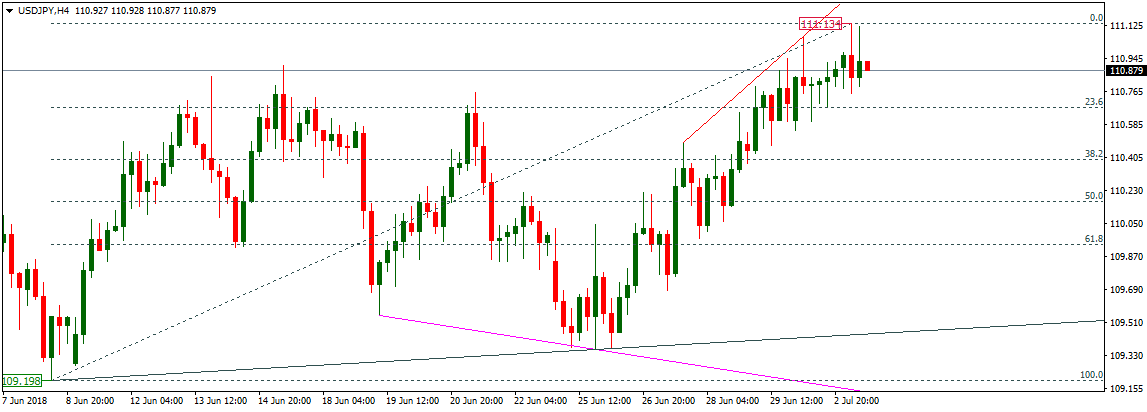
On the downside, a support may be seen near 109.26, an immediate trendline support area ahead of 107.97, the 50% fib level and then 107.55, another trendline support level as demonstrated with pink color in the above daily chart. The technical bias shall remain bullish as long as the 107.55 support level is intact.
US Manufacturing PMI
U.S. ISM manufacturing index rose sharply in June. The manufacturing index recovered in the month to 60.2 from May’s 58.7, surpassing the consensus expectations. Readings above 60 on the ISM manufacturing index are fairly rare; though there have been 117 readings of 6p or better on the index in the 846 observations since January 1948, only 12 have occurred after 1985.
There was widespread strength in the primary sub components. Production supplier deliveries, new export orders and imports all recorded higher readings in May. In the meantime, new orders, inventories and employment generally unchanged. The sharp rise in the ISM manufacturing index in June mirrors the above-consensus reading for the Chicago PMI that was released last week and is in line with other incoming data that indicates towards strong growth in the second quarter activity, stated Barclays in a research report.
Trade Idea
Considering the overall technical and fundamental outlook, selling the USDJPY pair near current levels appears to be a good strategy in short to medium term.