
Crude oil long-term projection
The impact of coronavirus on crude oil prices was massive. The price fell to a record low before it bounces and returns to the March opening level. Crude oil prices might continue under pressure as the virus continue to spread around the world.
Aside from the weak demand situation, OPEC members and allies working hard to cut oil production to historic levels. The massive cut in production is the reason behind the current bullish movement in crude oil prices.

If the coronavirus situation could be contained this year then crude oil might return to its January opening level.
New Month
Monthly chart
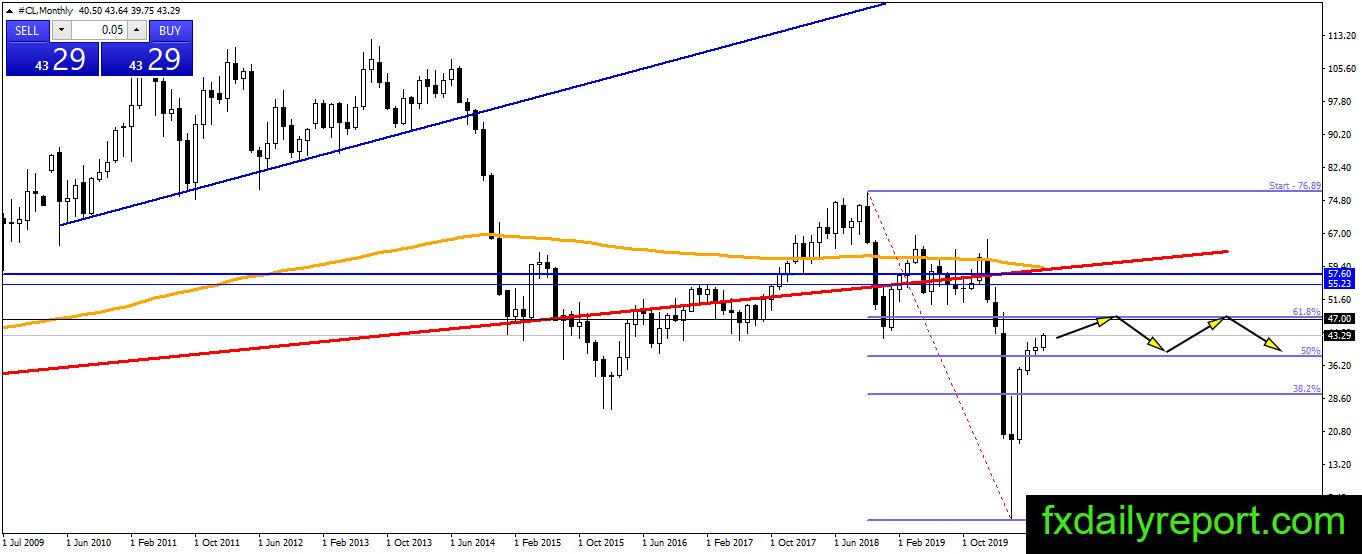
On the monthly chart, crude oil prices have surpassed the 50% Fibonacci Retracement level. The price continues its upward movement this month and might target the 61.8% retracement level. No bearish reaction yet at the current time which means traders will avoid short positions.
We have $47.00 as major levels to watch for a possible reversal.
Weekly chart
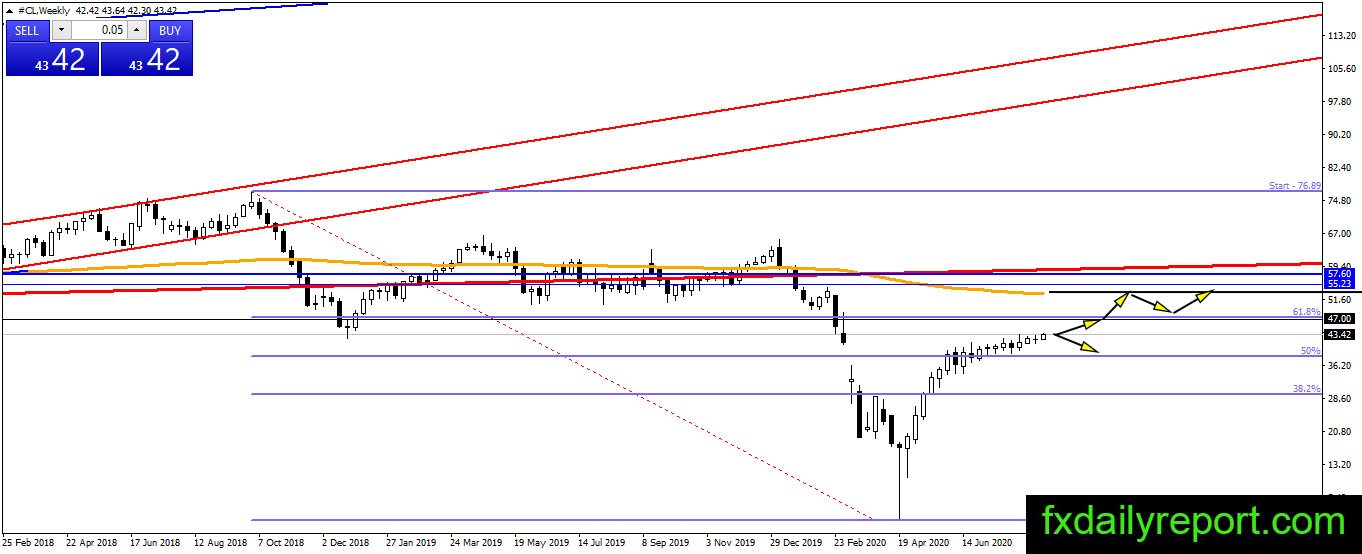
Crude oil has closed the bearish gap and currently sticks near the gap level. No major reactions at the current time and the bull attempting to bring the price further upward. Similar to the monthly outlook, upward continuation will target the 61.8% retracement level and $47.00. If the price shows a major bearish reaction then traders could enter short positions.
Daily chart
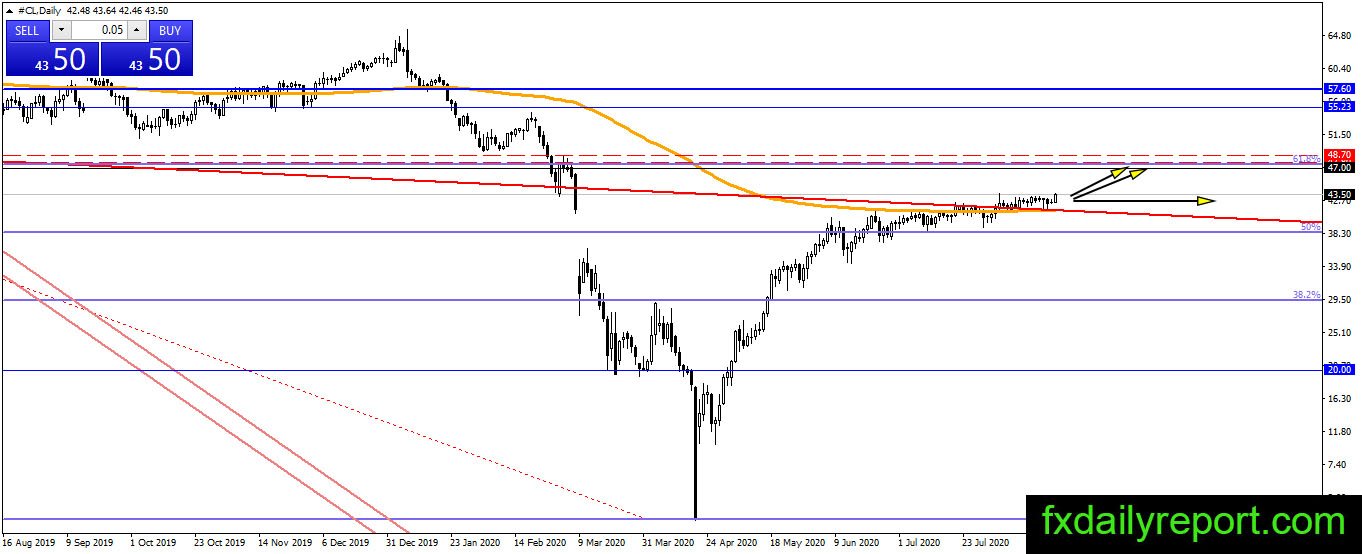
Crude oil prices slowly moving upward without much trouble. No change to the bullish outlook yet and traders will continue to avoid short positions for now. There is a bullish attempt to clear July’s high. If the price could close above July’s high then traders could expect the bullish trend could reach $47.00.
Trade plan
Avoid short positions as the trend continue bullish. Traders will continue to hold long positions until the price reaches either $47.00 or the 61.8% Fibonacci Retracement level. Depend on the global market situation, if the recovery continues strong then traders could hold long positions longer.