
The US dollar index (DXY) on Friday rallied to a new 3-month high of about 92.198 before pulling back late on to settle at 91.988. The USDX continues to trade within a sharply ascending channel formation in the 60-min chart.
The dollar currency index has now rallied several levels above the 100-hour and the 200-hour SMA lines. It also crossed to overbought levels of the 14-hour RSI before pulling back late on towards the normal trading zone.
The US Dollar Index Fundamentals Overview

From a fundamental perspective, the US dollar currency index is trading at the back of a relatively busy period in the US market. On Friday, the US jobs data for February outperformed the expectation of 182k with 379k jobs. The unemployment rate for the period eased to 6.2% down from 6.3% in January. This was also better than the February expectation of 6.3%. The average monthly wage growth of 5.3% was better than the estimated (YoY) growth rate of 5.1%.
Earlier in the week, the initial jobless claims for the week ending February 26 outperformed the expectation of 750k with a claim count of 745k. The continuing claims for the preceding week also came in better than expected at 4.295 million versus 4.3 million. The ISM Manufacturing PMI for February beat 58.8 with 60.8 while the Services PMI missed 58.7 with 55.3. The ADP employment change also came short of 177k with a job count of 117k.
The US Dollar Index Technical Analysis (the 60-min Chart)

Technically, the US dollar currency index appears to be trading within a sharply ascending channel formation in the 60-min chart. This indicates a strong short-term bullish bias in the market sentiment. The USDX is still locked in the overbought zone of the 14-hour RSI.
The bulls will look to retain the short-term momentum by targeting profits at around 92.198 or higher at 92.500. On the other hand, the bears will look to pounce for pullbacks at 91.763 or lower at 91.487.
The US Dollar Index Technical Analysis (the Daily Chart)
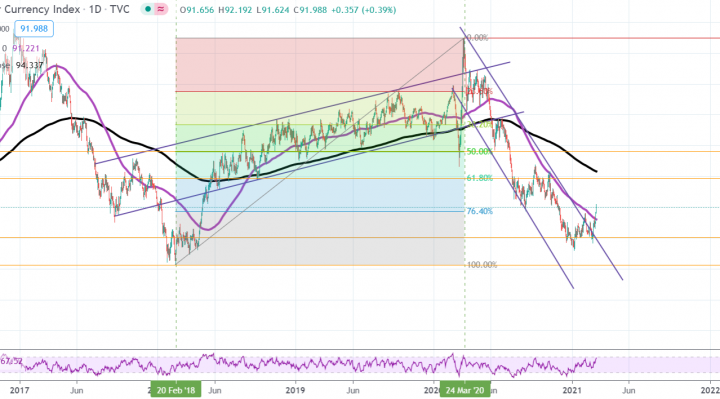
In the daily chart, the DXY appears to have recently made a bullish breakout from a sharply descending channel formation. This indicates an attempt by the bulls to seize control of the USDX from the bears.
They will be looking to extend the current rebound towards 61.80% and 50% fib levels at 93.871 and 95.625, respectively. On the other hand, the bears will target profits at 90.025 or lower at 100% fib level at 88.244.