
U.S dollar index long-term technical analysis
Traders and investors mostly feel anxious about rising U.S 10-year Treasury yield since the beginning of the year. Some analysts mentioned that the current rising yield mostly driven by money supplied to the economy from stimulus. It is different compared to the 2008 crisis where money was pumped into financial institutions. If the Fed could assure traders and investors that the current inflation is healthy as it is caused by money flowing to the people then the equity market will continue its upward movement.
On the other hand, if the market fear continues to increase then we might see flow out from the equity market into the U.S dollar. At the current time, the rising yield in U.S-treasury is positive for the U.S dollar index.
New Month
Monthly chart
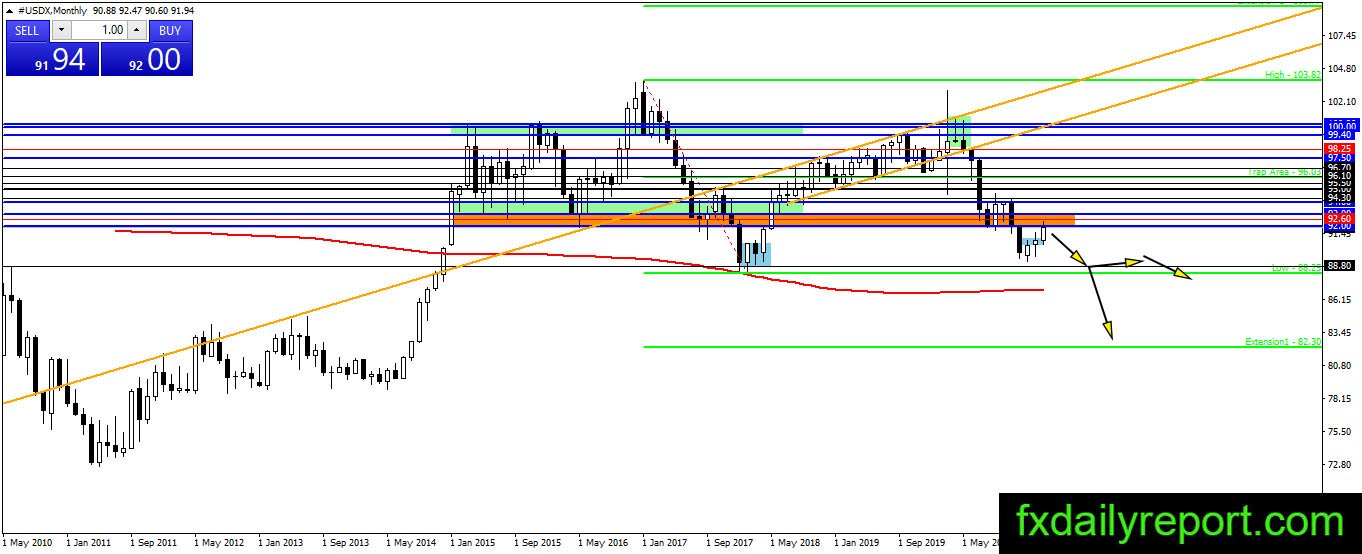


On the monthly chart, the U.S dollar index has not reached 2018 low and currently stage a bullish correction. The bullish correction is testing the orange box area or the 92.00 – 93.00 area. If a bearish rejection happens then the index is expected to continue its bearish trend to test the 2018 low.
A breakout below 2018 will trigger a major bearish trend below the monthly SMA 200.
Weekly chart
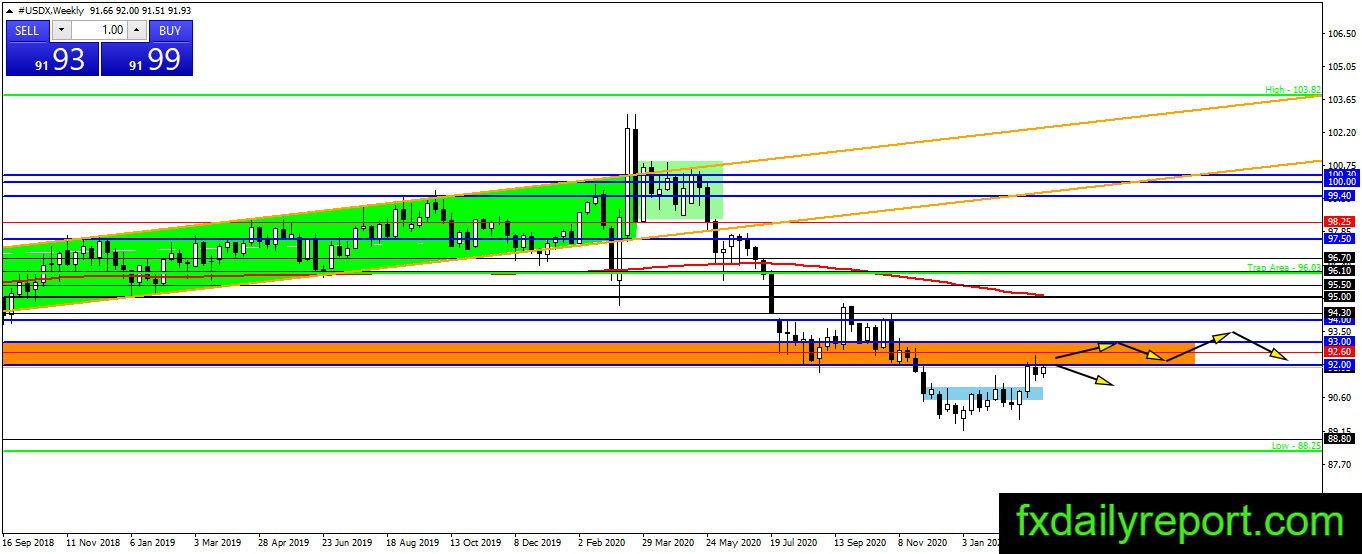
The bullish correction on the weekly chart has reached the 92.00 – 93.00 area. Last week, there was a bearish close near the level but not a major bearish reaction. Traders mostly focused on this week’s FOMC meeting. If the index produces a major bearish reaction after the Fed meeting then traders will prepare for a long-term bearish continuation toward the 2018 low.
Daily chart

Today is the awaited FOMC meeting and the index stick near 92.00 before the announcement. No conclusion yet where the index will move next. Traders might want to wait for a reaction after the FOMC meeting result is announced. On the upside, the index resistance is 93.00 and the daily SMA 200.
On the lower side, traders will observe the blue box area.
Trade plan (For U.S dollar pair)
We are currently at a crossroad, the index is moving in a bullish correction to test the orange box area. If the index gets rejected from the resistance level then it might continue the bearish trend to target a level below 2018 low. On the other hand, if the index could stage a bullish rally and close above the orange box area on the monthly chart then traders will expect the trend to change from bearish to bullish.