
The price of bitcoin on Thursday plunged to trade at a new weekly low of about $10,428 before bouncing back to top $10,600 late on. The latest pullback came off an ascending pattern formation in the 60-min chart. Before that, the BTC/USD had attempted a trend reversal after bottoming at $10,131 last week.
Thursday’s rebound helped the price of the pioneer cryptocurrency to bounce off oversold levels of the 14-hour RSI back to the normal trading zone. It remains pinned below the 100-hour and the 200-hour SMA lines.
Bitcoin Price Fundamentals Overview

The BTC/USD is often affected by a strong US dollar and on Thursday, there was plenty of information that might have changed the traders’ view of the greenback. On Thursday, the US ISM Manufacturing PMI for September missed the expectation of 56.3 with 55.4. The ISM Manufacturing Employment Index, Prices Paid and the New Orders Index all beat expectations. Earlier in the day, personal income for August missed the (MoM) expectation of -2.4% with a change of -2.7%. On the other hand, personal spending beat the expectation of 0.8% with 1%.
The initial jobless claims for the week ending Sep. 25 came in at 837k, slightly lower than the expected claims of 850k. Continuing claims for the preceding week also beat expectations of 12.225M with 11.767M. The core personal consumption price index for August outperformed the expectation of 1.4% with a change of 1.6%. Earlier in the week, the US GDP for Q2 missed the (QoQ) expectations of -2% with -2.1% but beat on an annualized basis with -31.4% versus the expected change of -31.7%.
Bitcoin Price Technical Analysis (the 60-min Chart)
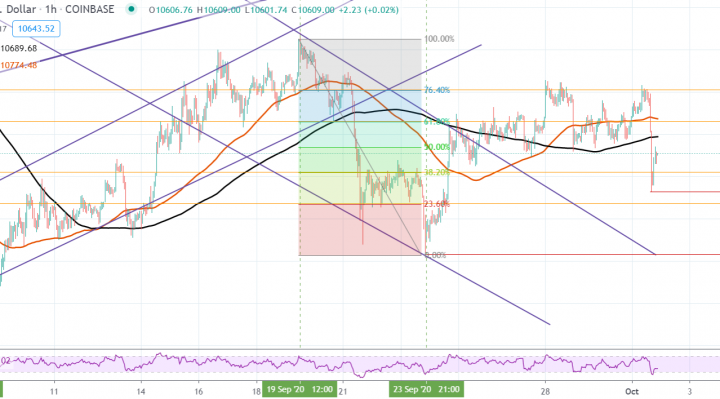
Technically, the BTC/USD appears to have recently bounced back following a sharp plunge. It has since returned to the normal trading zone of the 14-hour RSI after temporarily falling to the oversold zone.
The bulls will be looking to build on today’s late rebound by targeting short-term profits at around 61.80% and 76.40% fib levels at $10,762 and $10,912, respectively. On the other hand, the bears will look to pounce at 38.20% and 23.60% fib levels at $10,521 and $10,372, respectively.
Bitcoin Price Technical Analysis (the Daily Chart)
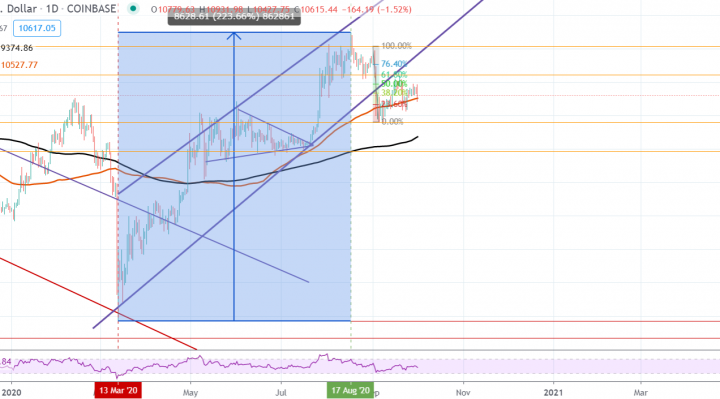
In the daily chart, bitcoin still appears to be on a recovery run following the massive plunge experienced at the start of September. It has since failed to go beyond the 38.20% Fib level after a series of pullbacks and rebounds.
The bulls will target long-term profits at around 61.80% and 100% fib levels at $11,221 and $12,075, respectively. On the other hand, the bears will look to pounce at 0.00% Fib level at $9,801 or lower at $8,932.