
The price of bitcoin on Friday plunged to trade at a new 6-week low of about $9,843 before bouncing back late on to trade at $10,500. The price of the pioneer cryptocurrency continues to trade in a sharply descending channel.
Bitcoin is now pinned several levels below the 100-hour and the 200-hour SMA lines in the 60-min chart. It has since crossed to overbought levels amid increased selling pressure. This triggered Friday’s late rebound.
Bitcoin Price Fundamentals Overview

From a fundamental perspective, the BTC/USD is trading at the back of a relatively busy period in the US market. On Friday, the US non-farm payrolls for August missed the expectation of 1.4 million with 1.37 million jobs. The labor force participation rate for the months slightly edged the consensus estimate of 61.4% with 61.7%. On the other hand, the unemployment rate eased lower to 8.4%. The market was expecting it to come in at around 9.8%.
Earlier in the week, the US ISM services PMI for August missed the expectation of 57 with 56.9. The ISM services’ prices paid, new orders index, and employment index all beat expectations. On the other hand, the ISM manufacturing index beat the expectation of 54.5 with 56. The ISM manufacturing prices paid, new orders index and employment index also outshone estimates. The ADP employment change for August came short of expectations with 428k versus 950k.
Bitcoin Price Technical Analysis (the 60-min Chart)
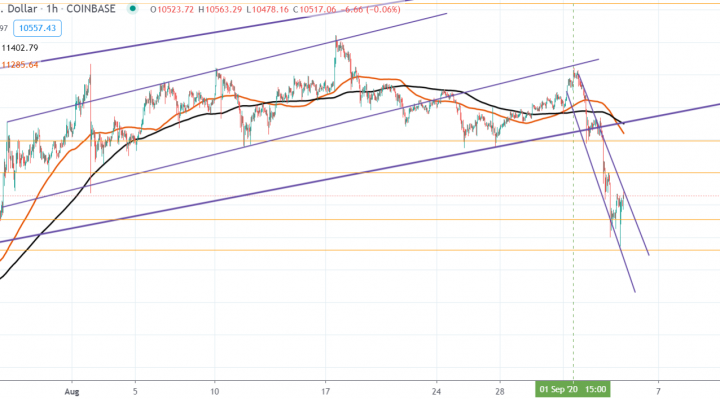
Technically, the price of bitcoin appears to be experiencing extreme short-term bearish pressure in the market sentiment. The BTC/USD is trading in a sharply diving channel, which indicates that the bears have control.
They will look to extend the current short-term declines towards $10,220 or lower to $9,843. On the other hand, the bulls will look to build on Friday’s late rebound by targeting profits at around $10,799 or higher at $11,189.
Bitcoin Price Technical Analysis (the Daily Chart)
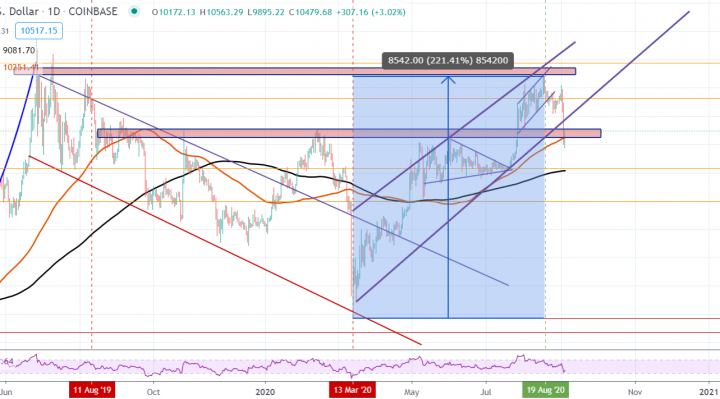
In the daily chart, the bitcoin price appears to have recently pulled back after a major rally that extends back to the start of the year. This pullback has pushed the BTC/USD closer to oversold levels of the 14-day RSI. This triggered Friday’s late rebound.
The bulls will target long-term profits at around $11,634 or higher at $12,877. On the other hand, the bears will look to build on the current pullback by targeting profits at around $9,155 or lower at $7,986.