
Bitcoin’s recent price movement has obtained significant attention among analysts and traders as the token broke out of a declining triangle pattern, triggering questions about the upcoming big development. However, today its price fell suddenly from $66,000 to $64,200 within a couple of hours raising concerns among traders. However, the 200-day moving average provided it a needed support.
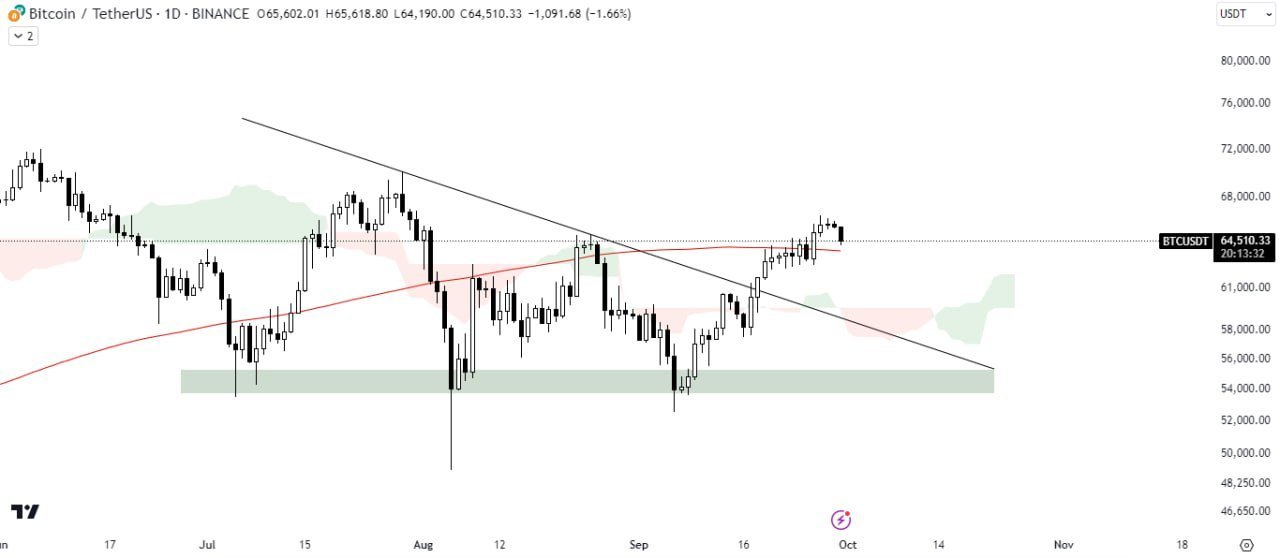

At present, the crypto token is changing hands at $64,600 above its 200-day moving average which is a critical support level, raising expectations about a bullish trend following a likely resilient monthly candle close.
Bitcoin Sees a Price Level Above Its 200MA, Indicating a Support
The top crypto’s recent breakout from the descending triangle pattern has reportedly placed it above the 200MA thereof. This presently works as a solid support level for Bitcoin. The respective technical indicator usually assists traders in gauging long-term trends. In addition to this, it plays a crucial role in analyzing the price movements in the future. The 200MA serves more than only offering a psychological support level. It is also a chief area that lets several institutional traders attempt to exit or enter positions.
At the current position, several analysts are anticipating a bounce. In this respect, if the price of the chief crypto token steadily holds and rebounds, it could highlight an upward momentum. This potentially leads to additional gains. A resilient bounce from Bitcoin’s 200MA would emphasize bullish sentiment, boosting buyers to move toward long positions.
Trending Now: Bitcoin Extends Gains to a New 8-Week High of About $66,482
Irrespective of the resilient support, the likelihood of a breakout below Bitcoin’s 200MA still raises concerns. If Bitcoin does not hold the respective level, there is a possibility for a downward trend. Ichimoku Cloud is the next defense line below the 200MA. It is a technical indicator offering extra support only above the respective pattern. This indicator has the potential to forecast the resistance and support zones. In the above-mentioned situation, it could work as a buffer to prevent additional decline.
Nonetheless, a break below both the respective indicators would point toward a shift leading to a bearish trend. This would reportedly increase the chance for a lengthened downward momentum.
September Candle Close May Lead to an Engulfing Candle Pattern
Another important factor that should be taken into consideration is the monthly candle close in September. In line with the statistics, if this month’s candle closes at a spot higher than $64,628, a bullish engulfing candle pattern would emerge within a timeframe of 1 month. Historically, the bullish engulfing candle works as a solid indicator of an explicit upward trend. If September candle closed in green, the historical pattern suggests the next three months will provide huge gains.