
The bitcoin price on Thursday spiked to trade at a new 18-month high of about $17,999 before pulling back to $36,419. The BTC/USD continues to trade within an ascending channel formation in the 60-min chart.
The price of the pioneer cryptocurrency is now trading at several levels above the 100-hour moving average line. As a result, bitcoin has ascended into the overbought levels of the 14-hour RSI.
Bitcoin Price Fundamentals Overview

From a fundamental perspective, bitcoin is trading at the back of a positive sentiment building amid the hype surrounding Bitcoin Spot ETFs. While US approvals remain pending with the SEC, news emerged earlier this week, that Hong Kong could consider joining the foray and allow Bitcoin Spot ETFs as part of its broader strategy for the crypto economy.
The BTC/USD is also affected by the latest round of US economic data. On Thursday, the initial jobless claims for the week ending November 3 narrowly beat the forecast of 218k with a claim count of 217k.
Earlier in the week, the US consumer credit for September missed the expectation of $10 billion with a reading of $9.06 billion. Wholesale inventories for the period also failed to match the expected change of 0% with a change of 0.2%. Elsewhere, Mortgage applications for the week ending November 3 increased by 2.5% compared to a change of -2.1% in the previous update.
Bitcoin Price Technical Analysis (the 60-min Chart)
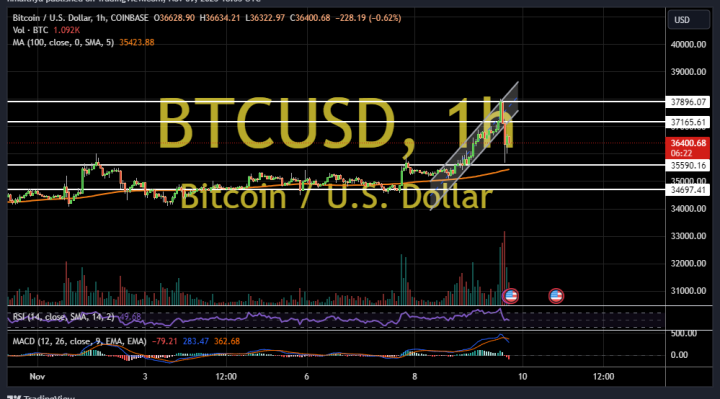
Technically, the price of the pioneer cryptocurrency seems to have recently completed a downward breakout from an ascending channel formation. The hourly MACD also appears to have recently completed a downward crossover, indicating a shift in the market sentiment.
Therefore, the bears will be targeting extended declines at about $35,490 or lower at $34,697. On the other hand, the bulls will look to pounce on rebounds at about $37,165 or higher at $37,896.
Bitcoin Price Technical Analysis (the Daily Chart)
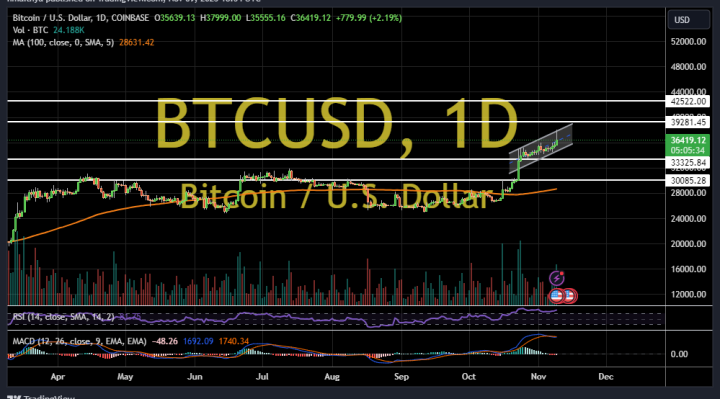
In the daily chart, the price of bitcoin appears to be oscillating within an ascending channel formation. However, the hourly MACD appears to be about to begin a downward crossover following Thursday’s late pullback.
Therefore, the bears will be targeting extended pullbacks at about $33,325 or lower at $30,085. On the other hand, the bulls will look to pounce on profits at about $39,281 or higher at $45,522.