
CADCHF has been trending lower within a descending channel on the short-term time frame, with price currently testing the channel bottom around the 0.5665 swing low.
This support floor has been holding so far, and a bounce from current levels could spur a corrective rally toward the Fibonacci retracement levels that mark potential resistance overhead. The Fibonacci retracement tool drawn from the latest swing high to the swing low shows where sellers could be waiting to resume the downtrend.

The 38.2% Fib is at 0.5700, followed by the 50% level at 0.5711, and the 61.8% Fib at 0.5721. A larger correction could reach the 100% level at 0.5756, which lines up closely with the channel top and could serve as the line in the sand for a bearish pullback.
As long as price stays within the descending channel and below the moving averages, the broader bearish bias remains intact and the slide could eventually extend below the current support floor.
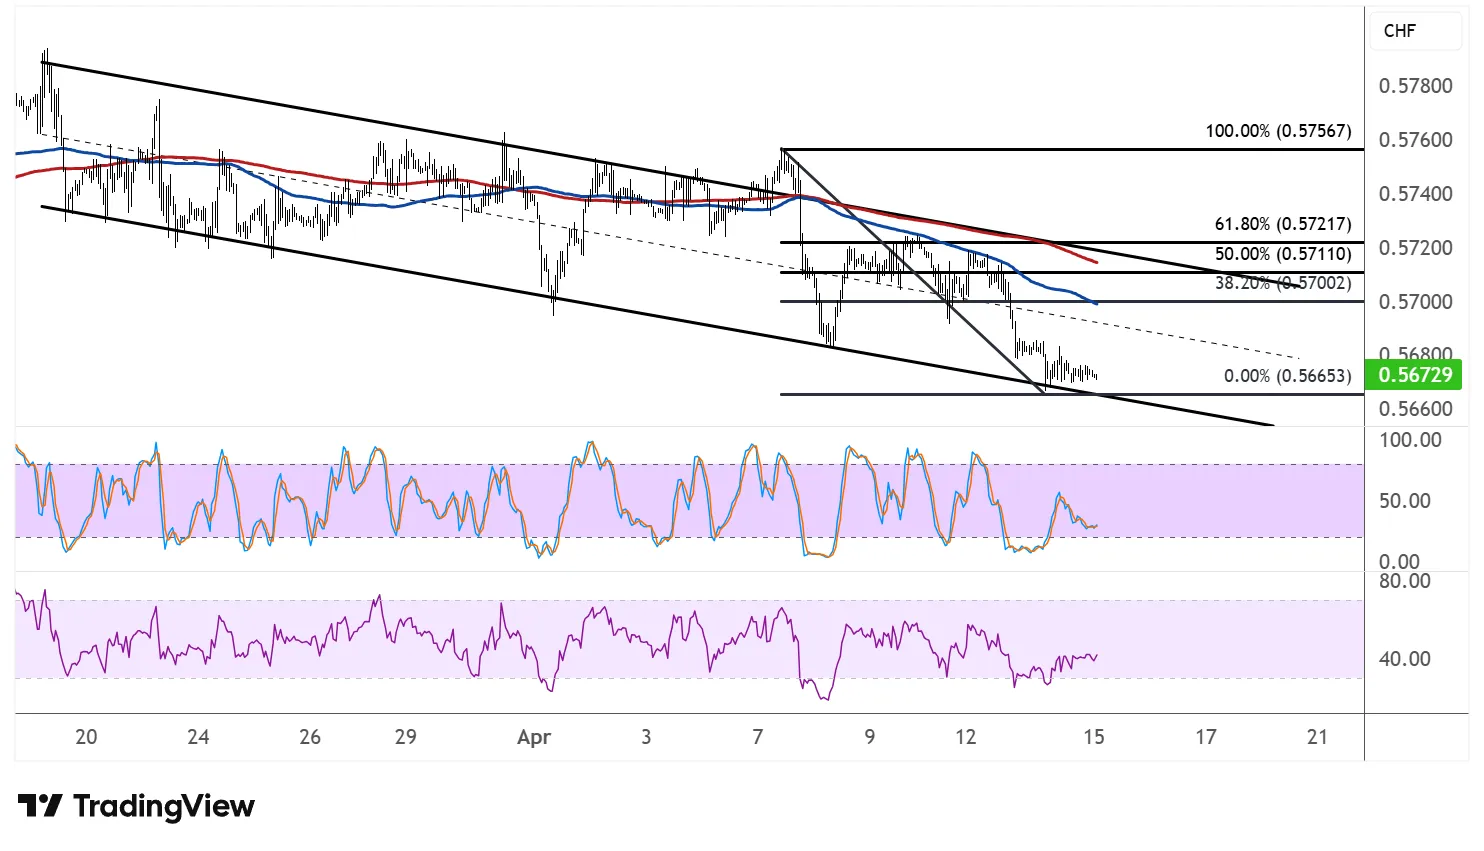
The 100 SMA has crossed below the 200 SMA to confirm that the path of least resistance is to the downside, and both moving averages are sloping lower while price trades beneath them. The indicators are positioned around the 0.57200–0.57400 area, which adds confluence to the Fibonacci resistance zone and could cap any recovery attempts.
Stochastic is turning higher from the oversold region, suggesting that buyers are starting to return after the extended selloff. If the oscillator continues climbing, a corrective bounce toward the 38.2% or 50% Fib levels could unfold before sellers look to hop back in.
RSI is also hovering in oversold territory and appears to be recovering, so there could be enough upside momentum to fuel a short-term retracement. However, the oscillator has yet to confirm a clear reversal, so the correction could remain shallow.
CADCHF could take cues from overall market sentiment, particularly geopolitical headlines and the progress on US-Iran peace talks, as easing tensions could point to weaker oil pressures on the Loonie.