
Natural gas is trending lower on the daily time frame, with price carving out a series of lower lows along a descending trendline that has guided the selloff since the January 2026 peak near $6.00.
The commodity is currently trading around $2.630, deep within a long-term support zone that stretches roughly between $2.500 and $3.000, highlighted by the blue shaded region on the chart.

Should the long-term support floor hold, natural gas could recover all the way up to $3.800 near the converging moving averages. A decisive breakdown below the $2.500 support zone, however, would invalidate the bullish divergence setup and open the door to deeper losses.
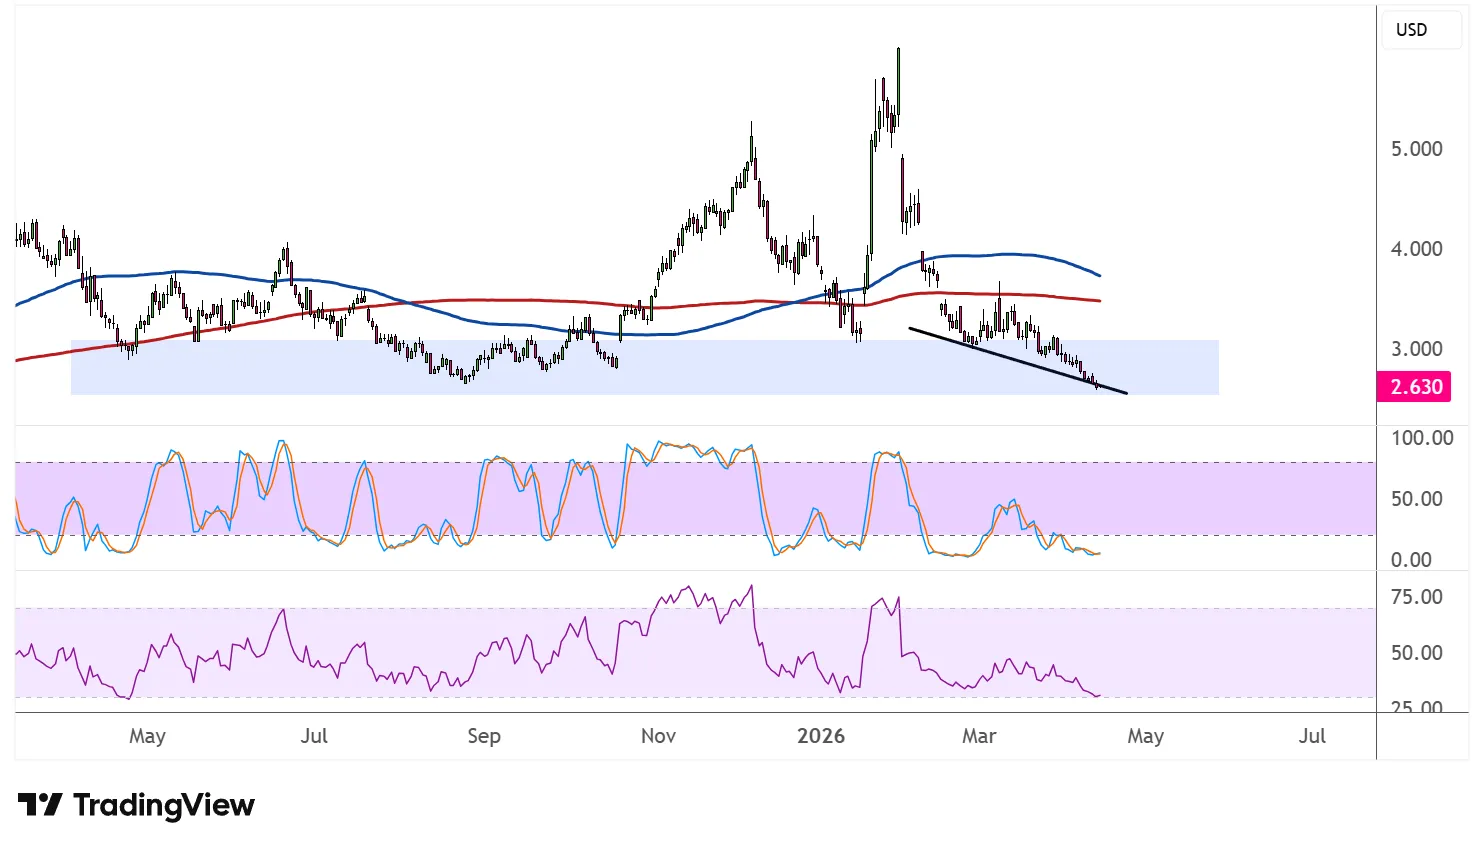
The 100 SMA is below the 200 SMA to confirm that the path of least resistance remains to the downside, and both moving averages are sloping lower to reinforce bearish pressure.
Price is trading well beneath these dynamic indicators, which could now act as resistance on any attempted recovery, with the 200 SMA around $3.500 and the 100 SMA near $3.800.
However, a notable bullish divergence is forming on the daily time frame. While price has been making lower lows, stochastic has been printing higher lows, a classic signal that downside momentum is fading and that buyers could be gathering strength at these long-term support levels. The oscillator is currently in oversold territory, which adds conviction to the potential for a reversal bounce.
RSI is also deep in oversold territory and appears to be curling upward, suggesting that sellers may be running out of steam. If the oscillator continues to climb, price could follow suit and stage a corrective rally from the support zone.
Natural gas could take cues from inventory data and weather forecasts, as expectations of weakening demand could mean downside pressures while global supply fears recede on the improving geopolitical landscape. Flaring tensions, on the other hand, could lead supply risks to resurface and put upside pressure on prices.