
Gold in consolidation
The price of gold undergo consolidation as the trade war between U.S and China proceed to phase one deal. No deal reached yet and recently President Trump postphoned tariff against China’s product and gave the market more positive sign.
Not much clue nearing the end of the year but all eyes might focus on the Fed now. At the current time, gold might continue its consolidation and might not have big movement range.

Click here to see Gold November 2019 forecast.
New Month
Monthly Chart
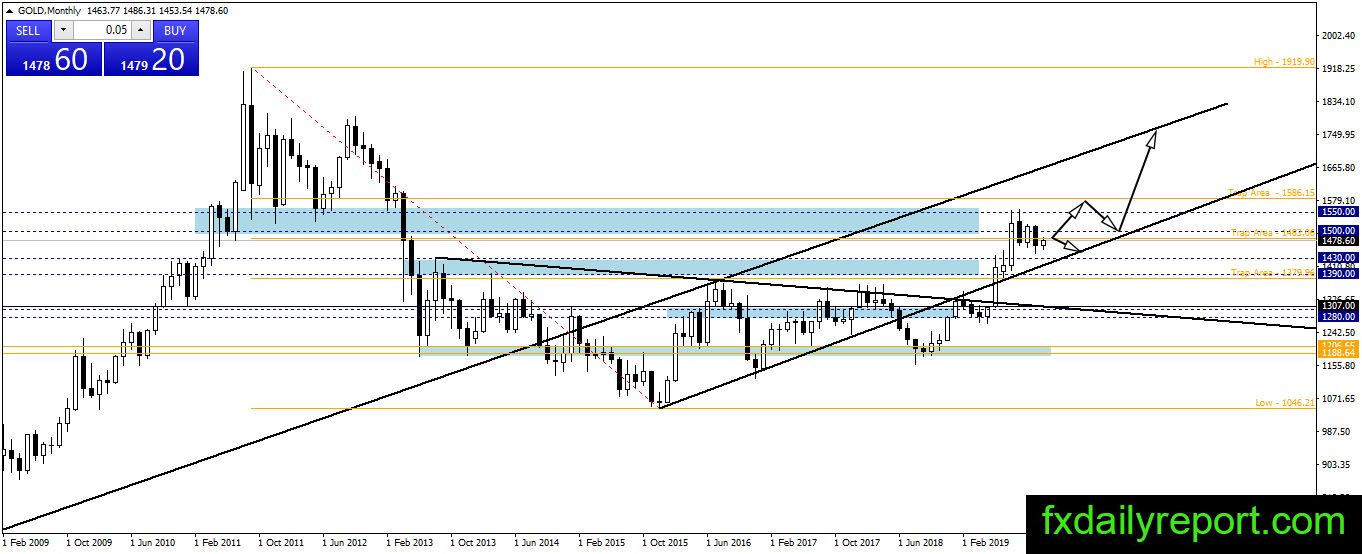
Gold made a bearish correction but no major pullback in the precious metal. At the current time, the price stick near $1,480 and waiting for bullish momentum. The overall trend of gold is bullish which means traders will avoid short positions for now.
Weekly Chart
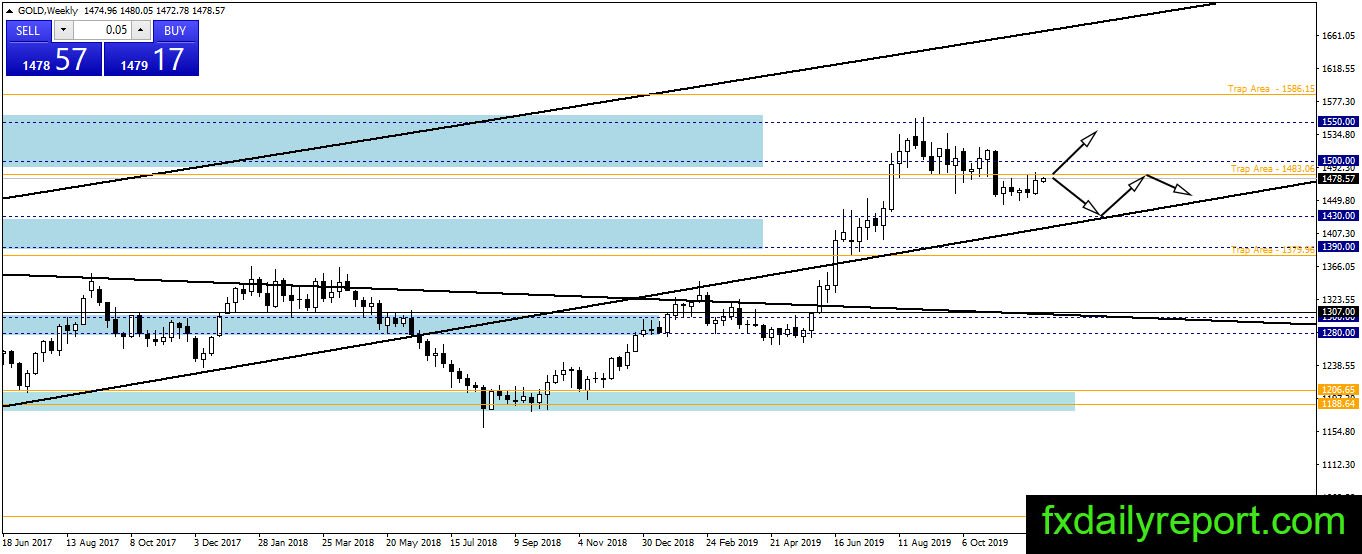
On the weekly chart, a flip below $1,480 – $1,500 happens and gold currently challenging the resistance level. Without a close above the resistance area then gold is at the risk of further bearish movement. If the price continues lower then traders could look for long positions near $1,430 and the channel.
Daily Chart
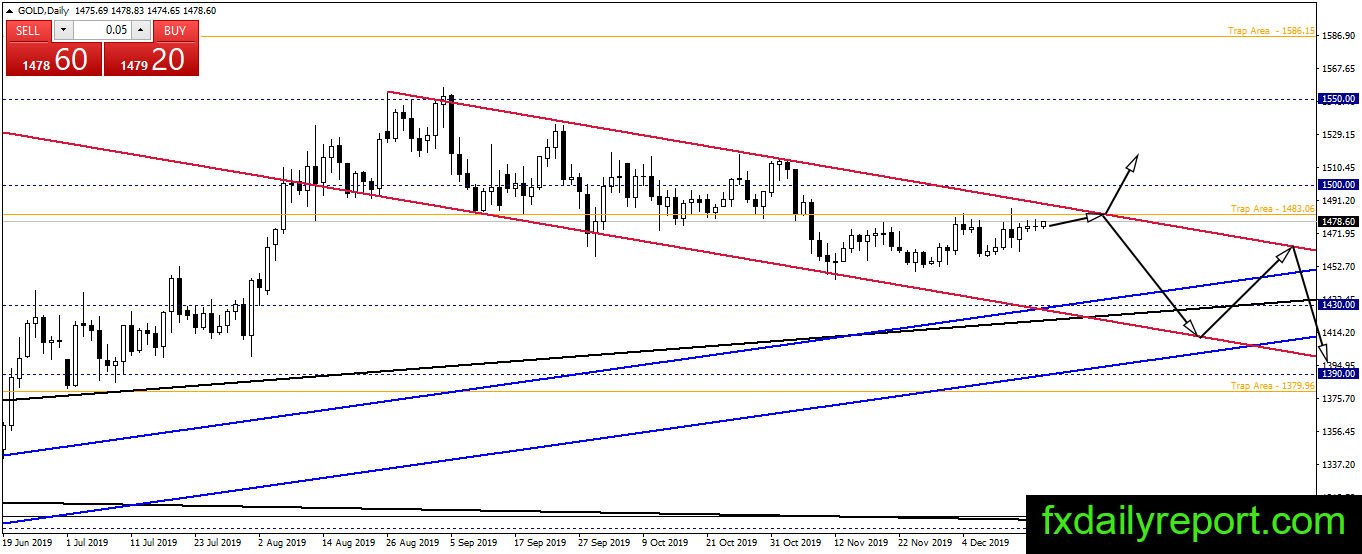
No much clue on the gold daily chart yet. The pair stay inside the bearish channel and currently consolidating near the top of the channel. Will the price get rejected from the top of the channel and continue its bearish trend inside the channel?
Trade Plan
Bullish trade – A long positions from $1,390- $1,430 is the option, traders could take when there is a bullish reaction. Another position to consider is a long position between $1,480 – $1,500 when the price manages to break out above it and retest the level.
Bearish trade – Short positions near $1,480 – $1,500 is an appealing strategy. Traders need to wait for bearish reaction on the daily chart. Short positions near the top of the channel on the daily chart also another option, traders could take.