
The price of gold on Friday pulled back off 2-month highs to trade at about $1,511 having rallied earlier on to top $1,514. The gold price has been on a bullish run since the start of the week rallying from about $1,475 to hit the current 2-month highs amid a thinly traded holiday period.
The price of the yellow metal has since returned to trade within the normal trading zone of the RSI indicator in the 60-min chart. The gold price made a bullish breakout early this week, which pushed it to overbought levels of the RSI.
Gold Price Fundamentals Overview

From a fundamental perspective, the price of gold is trading at the back of a relatively quiet period in the global financial markets. With most countries celebrating the Christmas and Boxing day holidays, there was nothing much to drive trading in the global markets.
However, for the little data that trickled in at the start of the week and on Thursday, the outcome was mixed thereby providing no impetus for the capital market investors.
On Monday, US durable goods orders for November missed the expectation of 1.5% with -2.0% while durable goods orders ex-transportation came short of 0.2% expected with 0.0%. On the other hand, durable goods orders ex-defense beat the expectation of 0.0% with 0.8% while non-defense capital goods orders ex-aircraft missed 0.2% with 0.1%.
On Thursday, initial jobless claims beat the expectation of 224,000 with 222,000 while the continuing claims missed 1.691M with 1.719M. The MBA mortgage applications for the week ending December 20, edged lower with a -5.3% change versus -5% change in the previous period.
Gold Price Technical Analysis (the 60-min Chart)
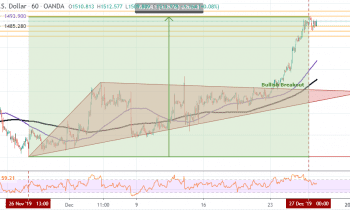
Technically, the gold price appears to be experiencing a short-term bullish bias after this week’s rally. However, following today’s consolidative pullback, the bears will be targeting more downward movement going into the tail-end of the year.
Therefore, the bears will target short-term profits at around $1,509, $1,507 or lower at $1,505. On the other hand, the bulls will hope for a quick rebound towards $1,514 or higher at $1,516.
Gold Price Technical Analysis (the Daily Chart)
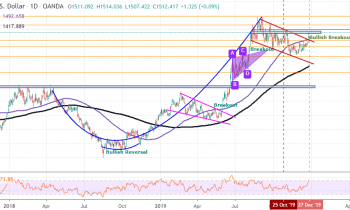
In the daily chart, the price of gold appears to have recently made a bullish breakout off a descending channel, which indicates an attempt by the bulls to trigger a trend reversal. The latest bullish run has pushed the gold price to trade close to the overbought levels of the RSI indicator in the daily chart and this could trigger a short-term pullback.
Therefore, the bears will target long-term profits at around $1,489 or lower at $1,471 while the bulls will be looking to strike at around $1,520, %1,533 or higher at $1,557.