
Natural gas is running into resistance at the descending trend line on the short-term chart, as the recent bounce from the lows appears to be losing steam around the $2.680 area.
Price tested this dynamic ceiling, which has been capping gains throughout the downtrend, and seems to be rolling over, suggesting that sellers may be ready to reassert control.

The Fibonacci extension tool marks the likely bearish targets from here. The nearest floor to watch is the 38.2% level at $2.632, which could offer a temporary pause.
If selling pressure picks up, the 50% Fib at $2.591 would be the next area of interest, followed by the 61.8% level at $2.549. A more extended drop could bring the 76.4% Fib at $2.498 into play, while a full continuation of the downtrend could eventually challenge the 100% extension at $2.415.
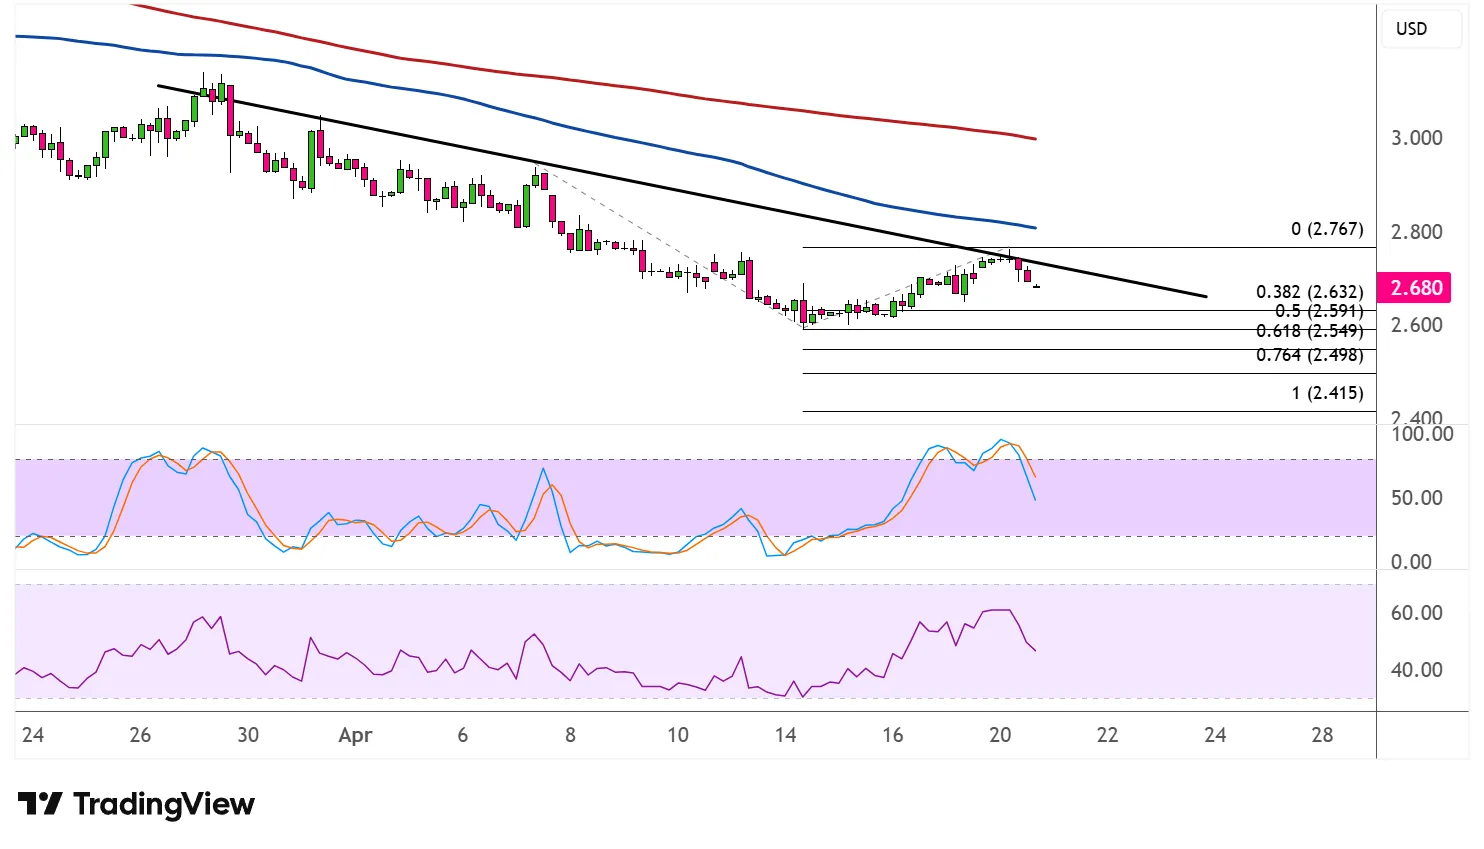
The moving averages reinforce the bearish outlook, as both the 100 SMA and 200 SMA are sloping downward above current price action, confirming that the path of least resistance remains to the downside. Price has yet to reclaim either indicator, so these continue to act as dynamic resistance on any attempted recovery.
Stochastic is turning lower from the overbought region, suggesting that buying momentum has faded and that sellers are starting to take the wheel. The oscillator has considerable room to fall before reaching oversold territory, leaving the door open for a sustained move lower.
RSI is also pulling back from elevated levels without quite reaching overbought, hinting that bearish pressure could intensify before any meaningful relief bounce materializes.
A decisive rejection at the descending trend line would keep the broader downtrend firmly intact, with $2.498 and $2.415 as the key levels to watch on the downside.
Natural gas could take cues from inventory data as rising stockpiles could reinforce the weakening demand narrative, though supply could remain restricted while tensions in the Middle East are elevated.