
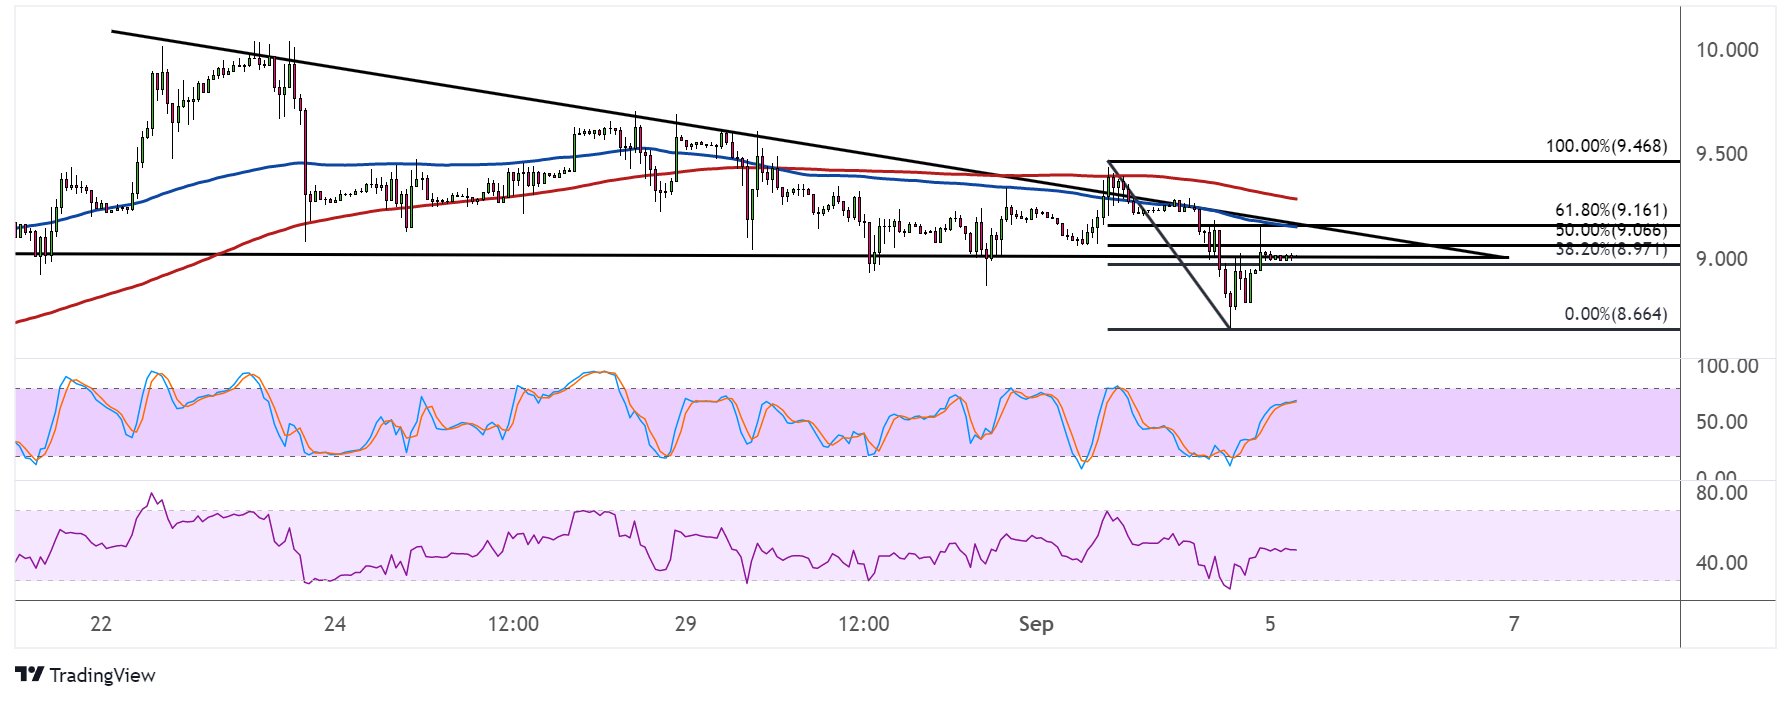
Natural gas recently fell through the bottom of its descending triangle, indicating that a selloff that’s the same size as the chart pattern would follow. Price is pulling up to the broken support for a retest.
This lines up with the 38.2% Fibonacci retracement level around $8.970, which appears to be holding as resistance. If so, natural gas could resume the drop to the swing low around $8.664 next.

The 100 SMA is below the 200 SMA to confirm that the path of least resistance is to the downside or that the selloff is likely to gain traction. Stochastic is still on the move up before reaching the overbought area, though, so there may be some bullish pressure left.
RSI also has some room to climb before reflecting exhaustion among buyers, so the correction might keep going for a while. The 100 SMA lines up with the 61.8% Fib at $9.161 which might be the line in the sand for a pullback.
A break above this area would suggest that a rally is in order.
Natural gas is on weaker footing as temperatures continue to drop, weighing on demand for cooling commodities. However, purchases could pick up in a few weeks, as businesses stockpile ahead of the winter season.
Keep in mind that the recent heatwaves led to a bit of an energy crunch, particularly in Europe, as the region is working on reducing reliance on Russian commodities. LNG imports from the US have led to lower domestic inventory levels, which then propped up natural gas prices throughout the summer season.
The same case could be observed in winter when demand for heating commodities picks up. The upcoming inventory report from the Department of Energy should have more insights on whether or not companies are starting to stock up for the season before prices get any higher.