Natural Gas (NATGAS/USD) Price Technical Analysis for August 17, 2026
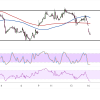
Natural gas is testing the lower end of its recent trading range after a sharp selloff knocked price back down from resistance near $2.814.

Natural gas is testing the lower end of its recent trading range after a sharp selloff knocked price back down from resistance near $2.814.
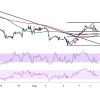
Natural gas broke above a long-standing descending trend line earlier this month, hinting that sellers were starting to lose their grip after weeks of lower highs.
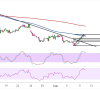
Natural gas appears to be staging a reversal after breaking above the descending trend line that had been capping its slide since early August.
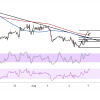
Natural gas broke above a long-standing descending trend line connecting its lower highs since late July, hinting that the downtrend which has dominated price action for the past few weeks may be losing steam.
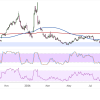
Natural gas has been grinding lower for several months now, with price recently slipping to the $2.631 mark as it approaches a long-term floor that’s held since the middle of last year.
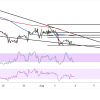
Natural gas broke down from its descending wedge on the four-hour time frame, with price slipping below the pattern’s lower trend line and confirming that sellers have regained the upper hand.
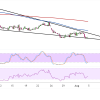
Natural gas is coiling inside a descending wedge, with both boundaries sloping lower and gradually converging near the $2.60 mark. Price is currently trading around $2.702 after finding support near the lower edge of the pattern and posting a small bounce off the wedge floor.
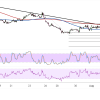
Natural gas is stalling below a descending trend line resistance that connects the lower highs formed since late June, as the commodity struggles to build on its recent bounce off the $2.700 mark.