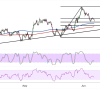
NZD/CAD Correction Mode, Support at .8100 Near Trend Line?
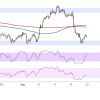
NZDCAD has been trending higher above a broad ascending trend line since April, with the pair recently printing a swing high at 0.8269 before retreating sharply to test key support levels.

NZDCAD has been trending higher above a broad ascending trend line since April, with the pair recently printing a swing high at 0.8269 before retreating sharply to test key support levels.

NZDCAD has been trending higher within a well-defined ascending channel since mid-March, and the pair is currently testing the upper boundary of the formation near the 0.8175 swing high.

NZDCAD is currently pressing against a critical horizontal support level at the 0.7933 area, having spent the better part of the past several weeks carving out a descending triangle pattern on the short-term time frame.
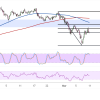
NZDCAD has broken sharply below a key support zone and is currently attempting a corrective bounce, with the Fibonacci retracement levels pointing to areas where sellers could be waiting to resume the downtrend.

NZDCAD is currently consolidating inside a symmetrical triangle pattern on its short-term time frame, with price testing the upper boundary around the 0.8210 handle.
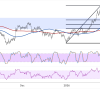
NZDCAD has broken above the key resistance zone around 0.8100, signaling that bullish momentum could be taking hold.
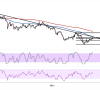
NZDCAD has been trading within a descending trend line on its 4-hour time frame, with price recently bouncing off the swing low around 0.7852.
NZDCAD has been consolidating within a well-defined range over the past several months, with resistance capping rallies around the 0.8250 minor psychological level and support providing a floor near 0.8050.