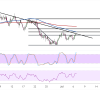
NZD/CHF Testing Trend Line Resistance As RBNZ Decision Looms
NZDCHF has been carving out lower highs connected by a descending trend line since early June, and the pair is now testing this resistance zone after bouncing off the 0.4558 low.

NZDCHF has been carving out lower highs connected by a descending trend line since early June, and the pair is now testing this resistance zone after bouncing off the 0.4558 low.

NZDCHF has been carving out an ascending triangle pattern on the short-term time frame, with the pair repeatedly testing the horizontal resistance around the 0.4640 level while chalking up higher lows connected by a rising trend line.
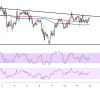
NZDCHF is currently trading around 0.4618, pressing against a descending resistance line that has been capping gains since late February.
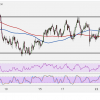
NZDCHF has been moving sideways on its hourly chart, finding support at the .6460 level and resistance around .6540. Price is closing in on the…
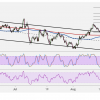
NZDCHF recently broke out of its long-term descending channel to indicate that a reversal from the downtrend is about to follow. Price is pulling back…
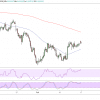
NZDCHF could be done with its slide as it forms a double bottom reversal pattern on its 4-hour chart. Price is testing the neckline of…

NZDCHF recently broke below the bottom of its ascending triangle visible on the 4-hour time frame to indicate that a selloff is in order. Price…

NZDCHF has formed higher lows and found resistance at the .6900 mark, creating an ascending triangle visible on its 1-hour chart. Price is currently testing…