
On Thursday, the USD/CAD currency pair pulled back from the session highs of about 1.4242 to trade at about 1.4207. The currency pair trades within an ascending channel formation in the 60-minute chart.
The pair has now fallen to trade closer to the 100-hour moving average line. Thursday’s pullback prevented the currency pair from ascending into the overbought levels of the 14-hour RSI.
USD/CAD Fundamentals Overview

From a fundamental perspective, the USD/CAD currency pair trades during a relatively busy period in both markets. On Wednesday, the U.S. building permits for January outperformed the expectation of 1.46 million with a tally of 1.483 million, up from 1.482 million.
On the other hand, the housing starts for the period missed the forecast of 1.4 million with 1.366 million down from 1.515 million. Earlier in the week, the NY Empire State Manufacturing Index for February improved to 5.7, up from -12.6 in January, beating the forecast of -1.
In Canada, the consumer price index for January matched the expectation of 0.1% (MoM) and 1.9% (YoY), up from the preceding month’s equivalent of -0.4% and 1.8%, respectively. The Bank of Canada’s consumer price index for the period also improved to 0.4% (MoM) and 2.1% (YoY), up from -0.3% and 1.8%, respectively. Traders will be looking forward to Canada’s retail sales data for January on Friday.
USD/CAD Technical Analysis (the 60-min Chart)
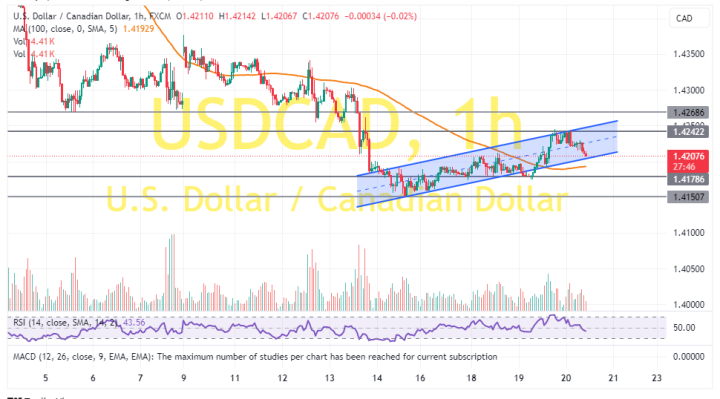
Technically, the USD/CAD currency pair trades within an ascending channel formation in the 60-minute chart. However, the 14-hour RSI has recently pulled back to avoid rallying into the overbought conditions.
Therefore, the bears will look to extend the current pullback towards 1.4178 or lower to 1.4150. On the other hand, the bulls will look to ride the current run of gains toward 1.4242 or higher to 1.4268.
USD/CAD Technical Analysis (the Daily Chart)
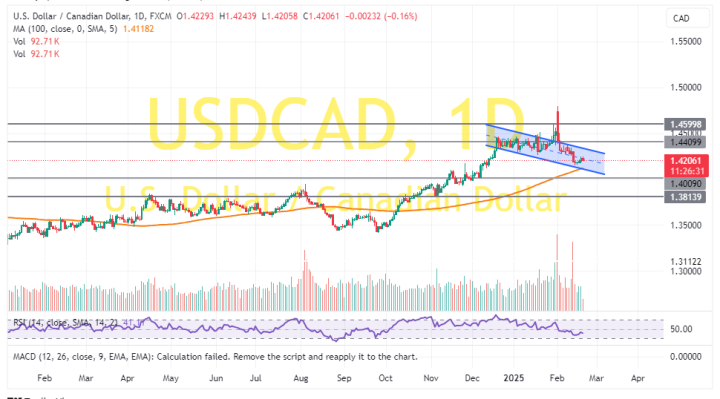
In the daily chart, the USD/CAD currency pair trades within a descending channel formation. The 14-day RSI also supports a bearish bias after pulling back to recover from the overbought conditions.
Therefore, the bears will look to ride the current run of declines toward 1.4009 or lower to 1.3814. On the other hand, the bulls will look to pounce on rebounds at about 1.4410 or higher at 1.4599.