
U.S dollar index long-term technical analysis
Rising inflation levels and the rising interest-rate prospect are the theme of this year. Analysts think the Fed has been left behind the inflation curve and will need to rise interest-rate aggressively. Under the current situation, the U.S dollar index trend will continue bullish until inflation come under control.
Traders will continue waiting for a pullback in the U.S dollar index for a chance to enter long positions in the U.S dollar.
New Month
Monthly chart
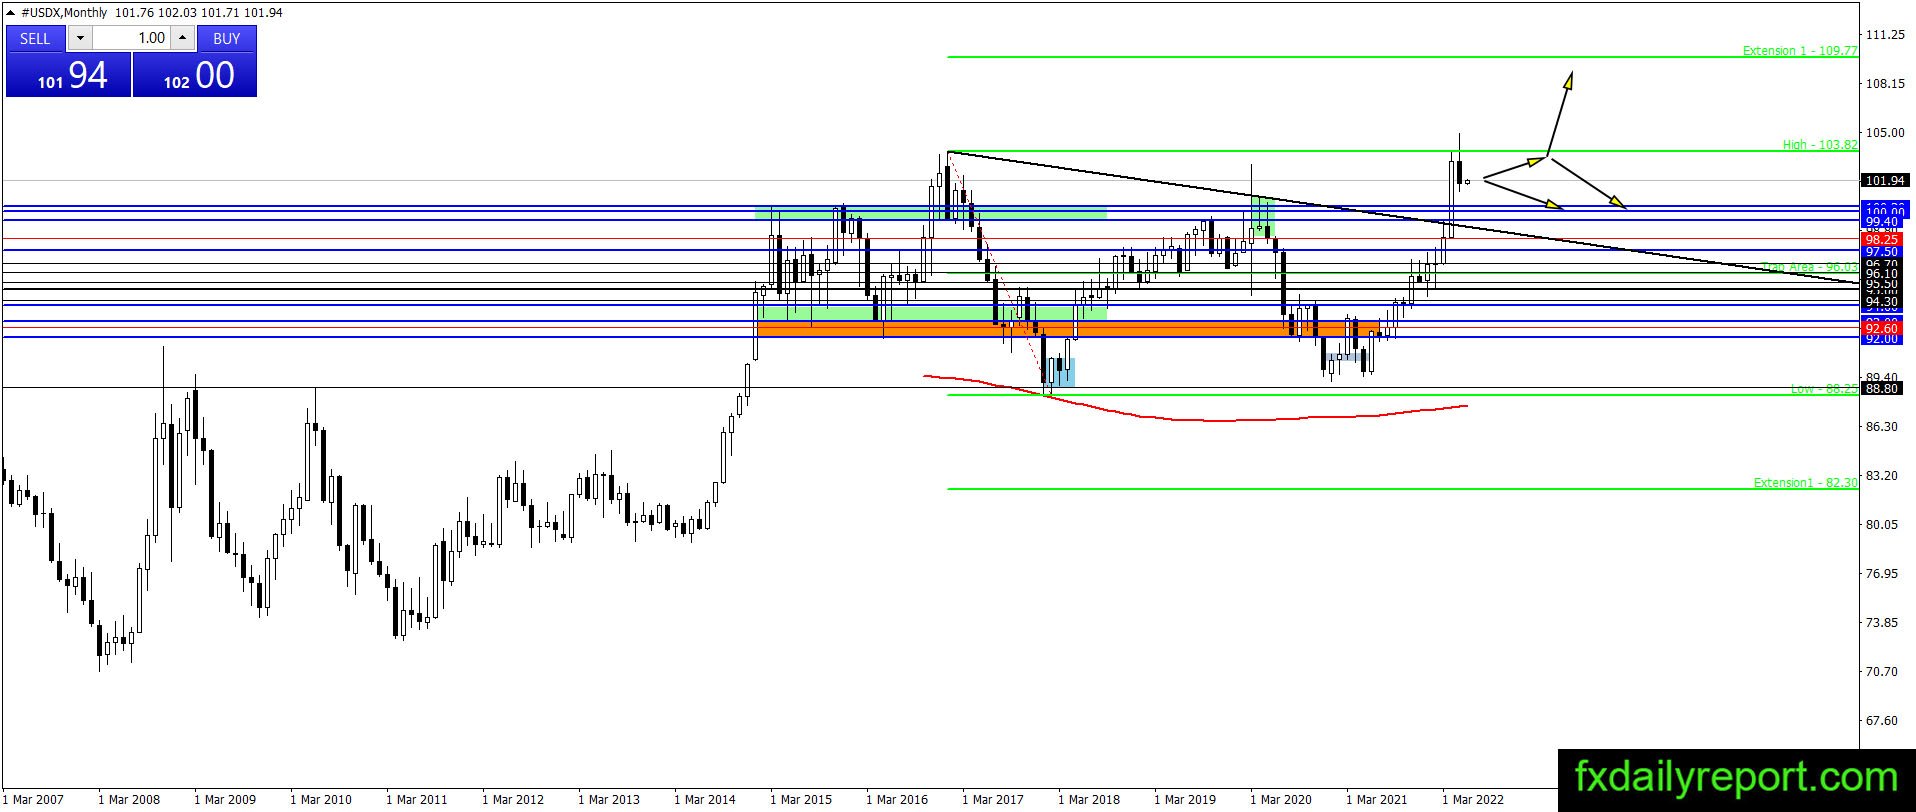

Last month, the U.S dollar index extend its bullish trend and printed a higher high on the chart. However, the index could not maintain the bullish pressure and reverse the direction. At the end of the month, the index closed lower. Despite the situation, there is a chance of bullish continuation and it is better for traders to avoid short positions in the U.S dollar for the medium-long term.
Weekly chart
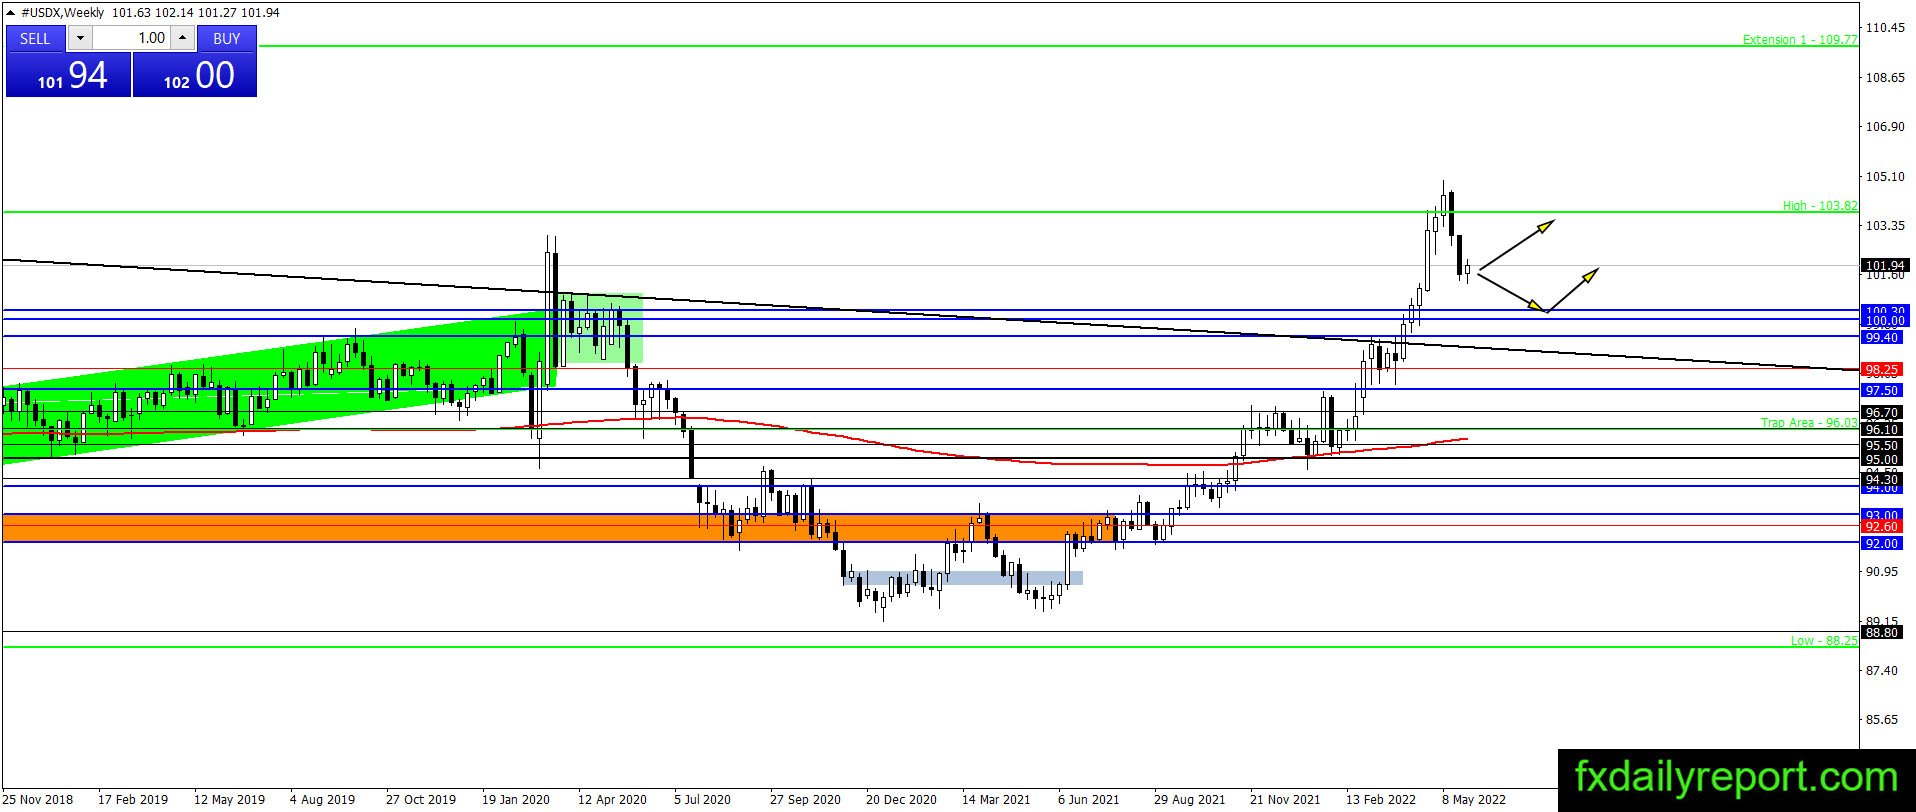
The weekly chart shows a bearish correction phase where traders will observe 99.40, 100.00 – 100.30 area for bounce reaction. The bearish correction might not reach the support levels as the long-term trend of the index is bullish. At the current time, traders will use the moment as a chance to enter long positions near the support level.
Daily chart
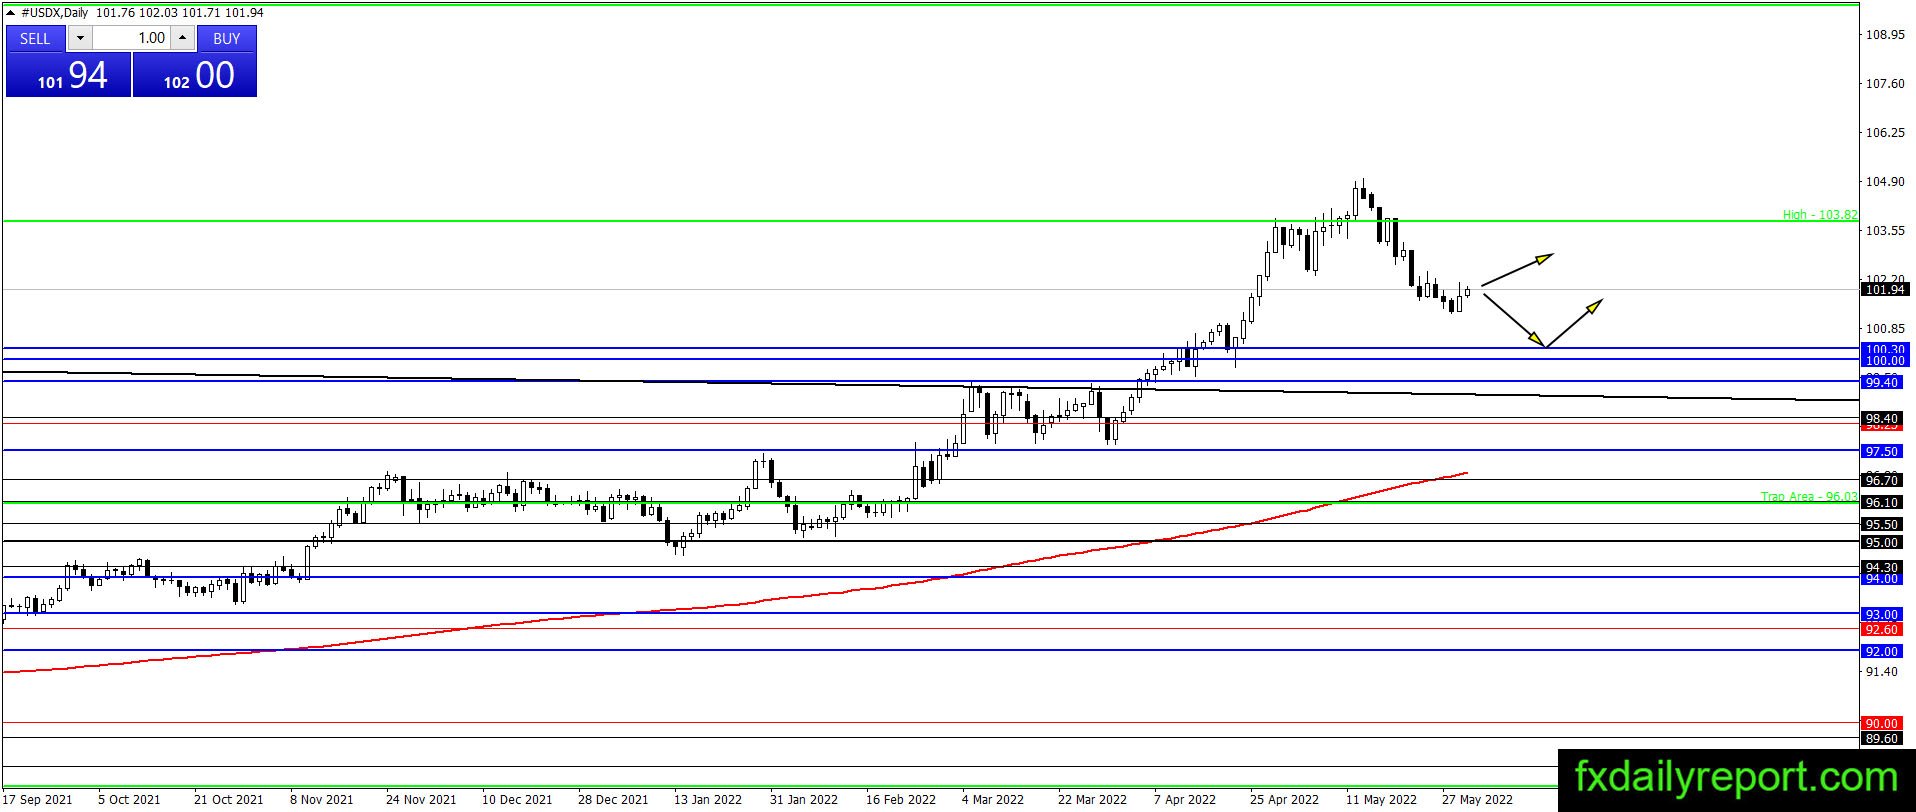
On the daily chart, the index follows the situation on the weekly chart. A bearish correction is in progress but we have a bullish reaction at the current level. Traders will continue waiting for the bearish correction to reach the 100.00 – 100.30 area. When the index reaches the area and forms a bullish reaction, traders could enter long positions.
Trade plan (For U.S dollar pair)
A bearish pullback is in progress toward the 100.00 – 100.30 and 99.40 support levels. Traders will wait for the index to reach support levels to enter long positions on bullish reactions. It is better to avoid shorting U.S dollar as the fundamental situation is in favor of strong U.S dollar.