
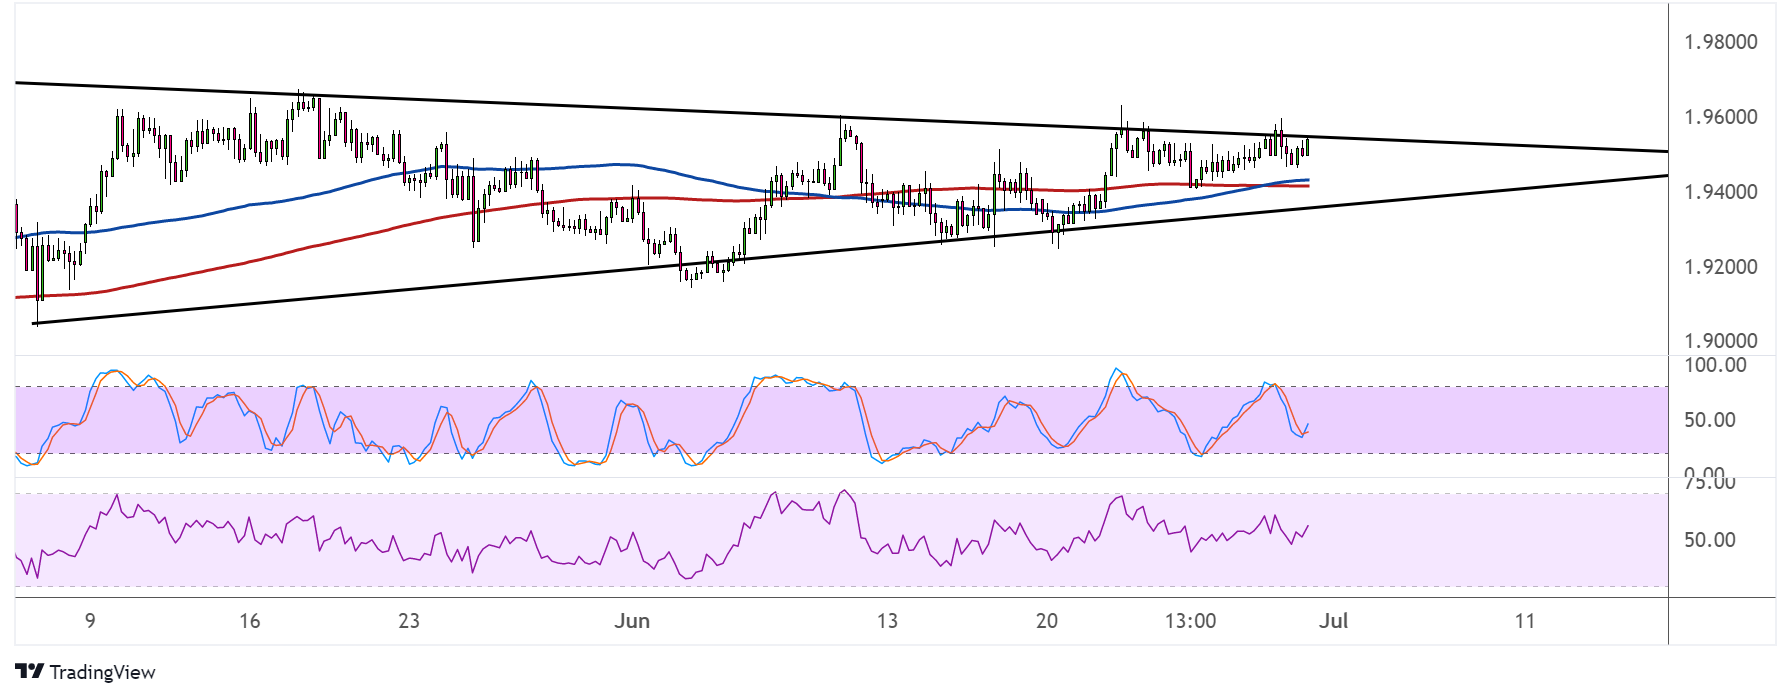
GBPNZD is consolidating with lower highs and higher lows inside a symmetrical triangle pattern on the 4-hour time frame. Price is testing the resistance and might be due for another dip to support.
Stochastic is on the move down to reflect selling pressure and has some ground to cover before reflecting oversold conditions. Stronger selling momentum might even spur a break below the triangle bottom around the 1.9400 handle, setting off a drop that’s the same height as the chart pattern.

RSI is on middle ground to reflect consolidation, barely offering directional clues at the moment.
The 100 SMA just crossed above the 200 SMA to indicate that the path of least resistance is to the upside or that the triangle top around 1.9550 is more likely to break than to hold. Then again, the moving averages might simply be oscillating to reflect consolidation as well.
There are no major reports lined up from the UK or New Zealand for today, although a handful of mid-tier reports from the former turned out weaker than expected.
The current account deficit widened from 7.3 billion GBP to 51.7 billion GBP versus the projected shortfall of 39.7 billion GBP. The Nationwide HPI printed a smaller than expected 0.3% uptick in house prices versus the estimated 0.5% gain and the earlier 0.9% increase. Lastly, the quarterly business investment figure was downgraded to show a 0.6% decline versus the estimated 0.5% dip.
In New Zealand, the ANZ business confidence index slumped from -55.6 to -62.6 to reflect stronger pessimism. Risk-off flows might also be bearish for the higher-yielding Kiwi, especially since the recent increase in borrowing costs could weigh on spending and investor sentiment.
The UK final manufacturing PMI is up for release before the end of this week, along with data on mortgage approvals and net lending to individuals.