
The AUD/USD currency pair on Friday extended declines to trade below the 100-hour moving average line after pulling back on Thursday. The currency pair appears to be trading within a sharply descending channel formation in the 60-min chart.
The pair had spiked earlier in the week to trade at a high of 0.6526 after bottoming at 0.6362. The currency pair has now descended to trade closer to the oversold conditions of the 14-hour RSI.
AUD/USD Fundamentals Overview

From a fundamental perspective, the AUD/USD currency pair is trading at the back of a relatively busy period in the US market. On Friday, the core personal consumption expenditures price index for Sep outperformed the expected (MoM) change of 0.5% with a change of 0.6%. On the other hand, the (YoY) equivalent beat the forecast of 4.7% with a change of 4.9%. However, the general personal consumption expenditures price index for the period missed the estimate of 6.6% with a change of 6.2% (YoY), while the (MoM) equivalent was in line with forecasts. Earlier in the week, the US gross domestic product price index for Q2 beat 8.9% with 9.1$.
In Australia, the seasonally-adjusted retail sales for August beat the expected (MoM) change of 0.4% with a change of 0.6% on Wednesday. Elsewhere, the monthly consumer price index for July and August came in at 7% (YoY) and 6.8% (YoY), respectively. Late in the week, private sector credit increased by 0.8% (MoM), in line with expectations and by 9.3% on a (YoY) basis.
AUD/USD Technical Analysis (the 60-min Chart)
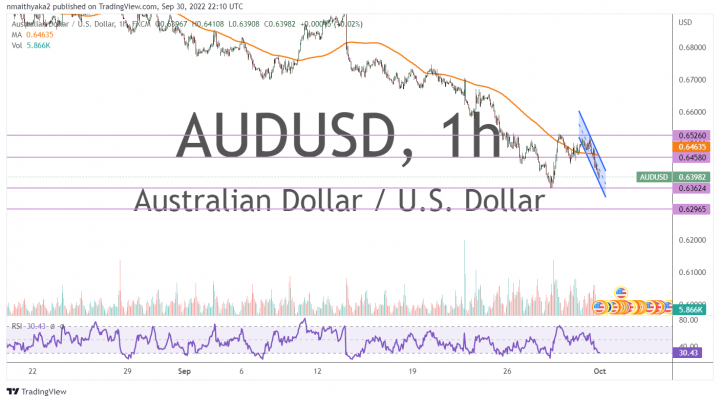
Technically, the AUD/USD currency pair seems to be trading within a descending channel formation in the 60-min chart. This indicates a significant short-term bearish bias in the market sentiment.
Therefore, the bears will be targeting short-term profits at about 0.6362 or lower at 0.6296. On the other hand, the bulls will be targeting potential rebound profits at about 0.6458 or higher at 0.6526.
AUD/USD Technical Analysis (the Daily Chart)

In the daily chart, the AUD/USD currency pair seems to be trading within a sharply descending channel formation. This indicates a strong long-term bearish bias in the market sentiment.
Therefore, the bears will be looking to ride the current downward trend towards 0.6203 or lower to 0.6003. On the other hand, the bulls will be targeting long-term profits at about 0.6625 or higher at 0.6815.