
The bitcoin price on Thursday pulled back off the session highs of about $34,857 to trade at about $33,897 following the latest round of data. The BTC/USD is trading within a descending channel formation in the 60-min chart.
The price of the pioneer cryptocurrency has now fallen to trade closer to the 100-hour moving average line. As a result, the bitcoin price is on the verge of entering the oversold zone of the 14-hour RSI.
Bitcoin Price Fundamentals Overview

From a fundamental perspective, the pioneer cryptocurrency is trading at the back of a relatively busy period in the market. Earlier this week, rumours broke that BlackRock’s Spot Bitcoin ETF application was close to being approved by the SEC. Last week, US Securities and Exchange Commission chair Gary Gensler stated that staff are considering multiple Spot Bitcoin ETFs.
In the latest US economic data, the preliminary gross domestic product price index for Q3 beat the annualised forecast of 4.2% with a change of 4.9%. The preliminary US gross domestic product price index for the period also outshone the estimate of 2.5% with a change of 3.5%, while the initial jobless claims for last week missed 208k with a tally of 210k.
Elsewhere, the durable goods orders for September beat the expectation of 1.5% with a change of 4.7%. The durable goods ex-transportation also outshone 0.2% with 0.5%, while nondefence capital goods orders for the period beat 0.2% with a change of 0.6%.
Bitcoin Price Technical Analysis (the 60-min Chart)
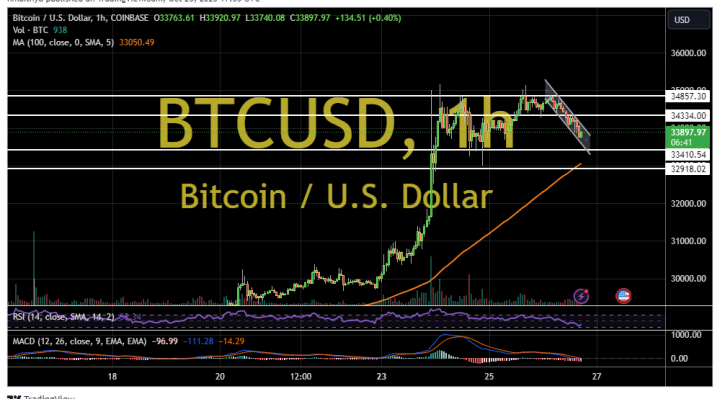
Technically, the price of the pioneer cryptocurrency appears to be trading within a descending channel formation in the 60-min chart. However, the hourly MACD seems to be struggling for momentum after completing a downward crossover.
Therefore, the bulls will be targeting potential rebounds at about $34,334 or higher at $34,857. On the other hand, the bears will look to pounce on extended declines at about $33,410 or lower at $32,918.
Bitcoin Price Technical Analysis (the Daily Chart)
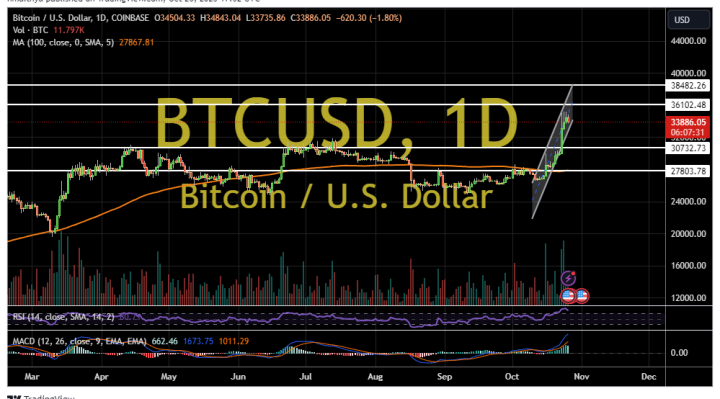
In the daily chart, the bitcoin price appears to be trading within a sharply ascending channel formation. The daily MACD also appears to support a bullish bias after completing an upward crossover.
Therefore, the bulls will be looking to ride the current rally towards $36,102 or higher to $38,486. On the other hand, the bears will be targeting long-term profits at about $30,732 or lower at $27,803.