
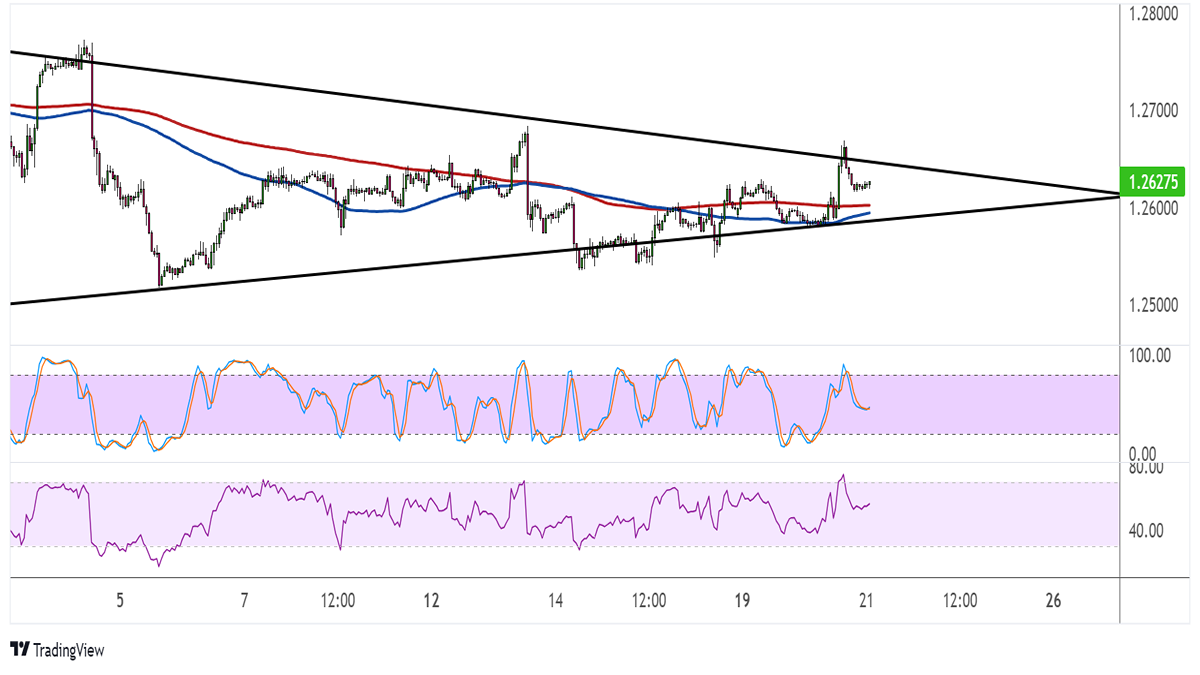
GBPUSD has formed lower highs and higher lows to consolidate inside a symmetrical triangle pattern on its hourly time frame. Price is testing the resistance and might be due for a dip back to support again.
The 100 SMA is below the 200 SMA to indicate that the path of least resistance is to the downside. Sustained bearish pressure might even spur a break below support and a drop of the same height as the chart formation, which spans around 200 pips.

Price is still above the moving averages, though, so these might hold as dynamic support near the triangle bottom at the 1.2600 major psychological mark.
Stochastic is pointing down to confirm that sellers have the upper hand and could drag the pair further south. RSI also has room to move south before reaching the oversold region, but the oscillator appears to be changing its mind midway. Turning higher might signal that buyers are refusing to back down.
A pickup in bullish pressure could still spur a break above the triangle top and a rally of the same size as the triangle.
GBPUSD is likely to take cues from the release of the FOMC meeting minutes, as hawkish commentary from Fed officials is expected.
Recall that the central bank kept rates unchanged as expected in their latest decision but dashed hopes for seeing rate cuts anytime soon. Speeches from FOMC members and top-tier data like CPI and NFP figures also dampened expectations for easing by March or May.
However, any cautious remarks in the FOMC minutes might still lead to some profit-taking for dollar rallies, as traders have pretty much priced in the idea of seeing upbeat rhetoric from policymakers.
Meanwhile, the Monetary Policy Report hearings turned out mostly bullish for the pound, as the central bank suggested upside for the economy soon despite slumping into recession.