
On Friday, the USD/JPY currency pair pulled back off the session highs of about 156.70 to trade at about 155.54. The pair also completed a downward breakout from an ascending channel formation in the 60-minute chart.
Friday’s early pullback pushed the currency pair closer to the 100-hour moving average line. The pair is now on the verge of entering the oversold levels of the 14-hour RSI.
USD/JPY Fundamentals Overview

From a fundamental perspective, the USD/JPY currency pair trades during a relatively busy period in both markets. On Thursday, Japan’s preliminary gross domestic product for Q3 matched the expectation of 0.2%, down from 0.5% in the previous update.
The annualised GDP for the period also registered a lower change of 0.9% versus 2.2% in the preceding period, beating the forecasted change of 0.2%. The preliminary gross domestic product deflator delivered a change of 2.6%, down from 3.2%.
In the U.S., the initial jobless claims for the week ending November 8 came in lower than expected with 217k, down from 221k, beating the forecast of 223k. On the other hand, the producer price index for October exceeded the expectation of 2.3% (YoY) with 2.4%. The (MoM) equivalent was in line with the estimate of 0.2%.
On the other hand, the producer price index ex-food and energy beat the expectation of 3% with 3.1% (YoY), while the (MoM) equivalent matched the forecast of 0.3%. Traders will be looking forward to the U.S. retail sales data later on Friday.
USD/JPY Technical Analysis (the 60-min Chart)
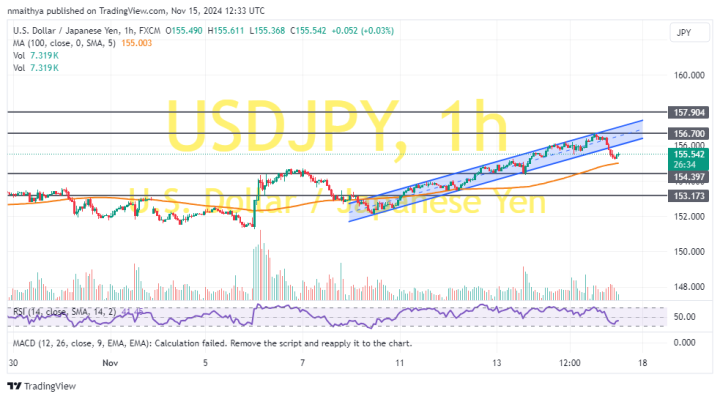
Technically, the USD/JPY currency pair has completed a downward breakout from an ascending channel formation. The 14-hour RSI has also moved closer to the oversold conditions.
Therefore, the bears will look to extend the current pullback towards 154.39 or lower to 153.17. On the other hand, the bulls will look to pounce on rebounds at about 156.70 or higher at 157.90.
USD/JPY Technical Analysis (the Daily Chart)
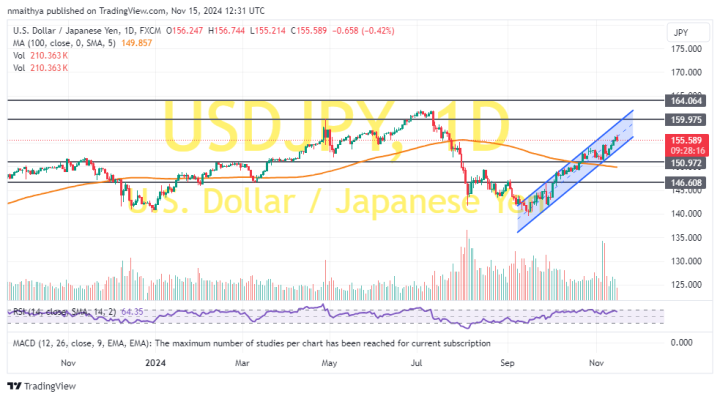
In the daily chart, the USD/JPY currency pair trades within an ascending channel formation. The 14-day RSI also supports a long-term bullish bias as it moves closer to the overbought conditions.
Therefore, the bulls will look to extend the current rally towards 159.97 or higher to 104.06. On the other hand, the bears will look to pounce on pullbacks at about 150.97 or lower at 146.60.