
On Friday, the AUD/USD currency pair pulled back from the session highs of about 0.6587 to trade at about 0.6554. The currency pair recently completed a double-bottom reversal pattern formation in the 60-minute chart.
The pair continues to trade slightly above the 100-hour moving average line, despite the pullback. Friday’s pullback helped the currency pair recover from the overbought levels of the 14-hour RSI.
AUD/USD Fundamentals Overview

From a fundamental perspective, the AUD/USD currency pair trades during a relatively busy period in both markets. On Friday, the US jobs data for August came in weaker than expected, with 22k versus a forecast of 75k, down from the previous month’s equivalent of 79k. The average hourly wage growth for the period matched the forecasted (MoM) and (YoY) changes of 0.3% and 3.7%, respectively. The unemployment rate for the month edged slightly higher to 4.3%, up from 4.2% in July, in line with estimates.
Earlier in the week, the U.S. nonfarm productivity for Q2 outperformed the expected change of 2.4% with a change of 3.3%, while unit labour costs for the quarter missed the forecast of 1.6% with a change of 1%. The S&P Global Composite PMI for August also fell short of 55.4, with a reading of 54.6.
In Australia, the trade balance for July beat the (MoM) expectation of 4,920 million, with 7,310 million. The gross domestic product for Q2 also outshone the (QoQ) and (YoY) estimates of 0.5% and 1.6%, respectively, with changes of 0.6% and 1.8%. The S7P Global Services PMI for August exceeded the forecast of 55.1 with a reading of 55.8.
AUD/USD Technical Analysis (the 60-min Chart)
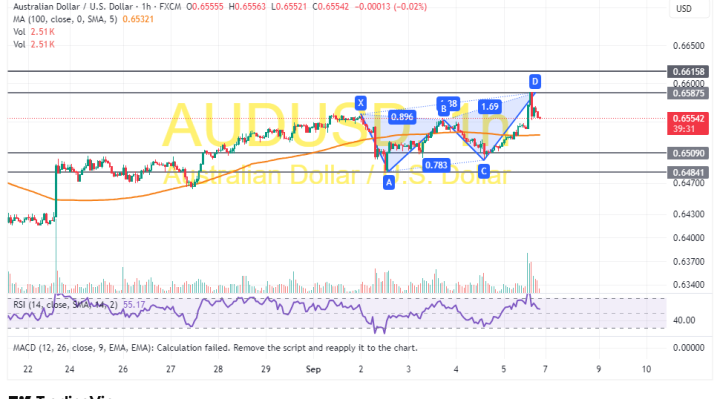
Technically, the AUD/USD currency pair has recently completed a double-bottom reversal pattern formation in the 60-minute chart. However, the 14-hour RSI has recently pulled back to recover from overbought conditions.
Therefore, the bears will look to extend the current pullback towards 0.6509 or lower to 0.6484. On the other hand, the bulls will look to pounce on profits at about 0.6587 or higher at 0.6615.
AUD/USD Technical Analysis (the Daily Chart)
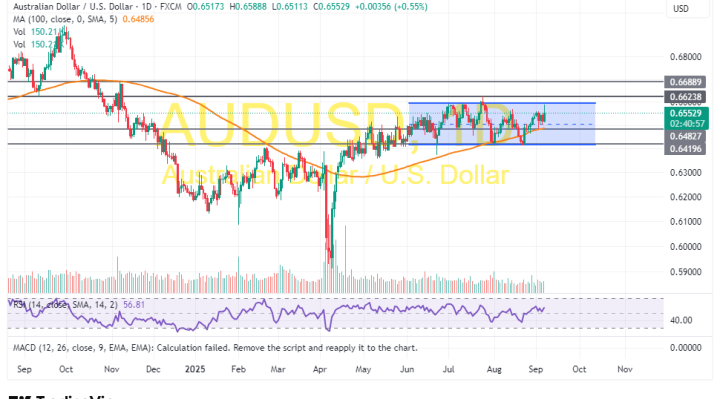
In the daily chart, the AUD/USD currency pair trades within a sideways channel formation. However, the 14-day RSI has recently bounced back to move towards overbought conditions.
Therefore, the bulls will look to ride the current rebound towards 0.6673 or higher to 0.6689. On the other hand, the bears will look to pounce on profits at about 0.6482 or lower at 0.6419.