
GBPJPY has broken above a significant resistance zone highlighted around the 200.00 major psychological handle, signaling that bullish momentum is gaining traction.
The pair is currently trading around 201.88, having successfully cleared this psychological barrier that previously capped gains. The breakout above the resistance area is a bullish development, suggesting that buyers have overcome a key obstacle.

However, price could still pull back to retest the broken resistance, which might now hold as support. The Fibonacci retracement tool shows where more buyers could be waiting to join in.
The 61.8% Fib is at 200.549, which aligns closely with the broken resistance zone and could be the first line of defense for bulls. The 50% level is at 201.457, very near current price action, while the 38.2% Fib sits at 202.366. Any of these levels could attract bullish momentum on a pullback.
If the broken resistance at 200.00 or any of the Fibs are able to hold as a floor, GBPJPY could resume the rally to the swing high near 205.30 or higher. A sustained move above this ceiling would open the door for further gains.
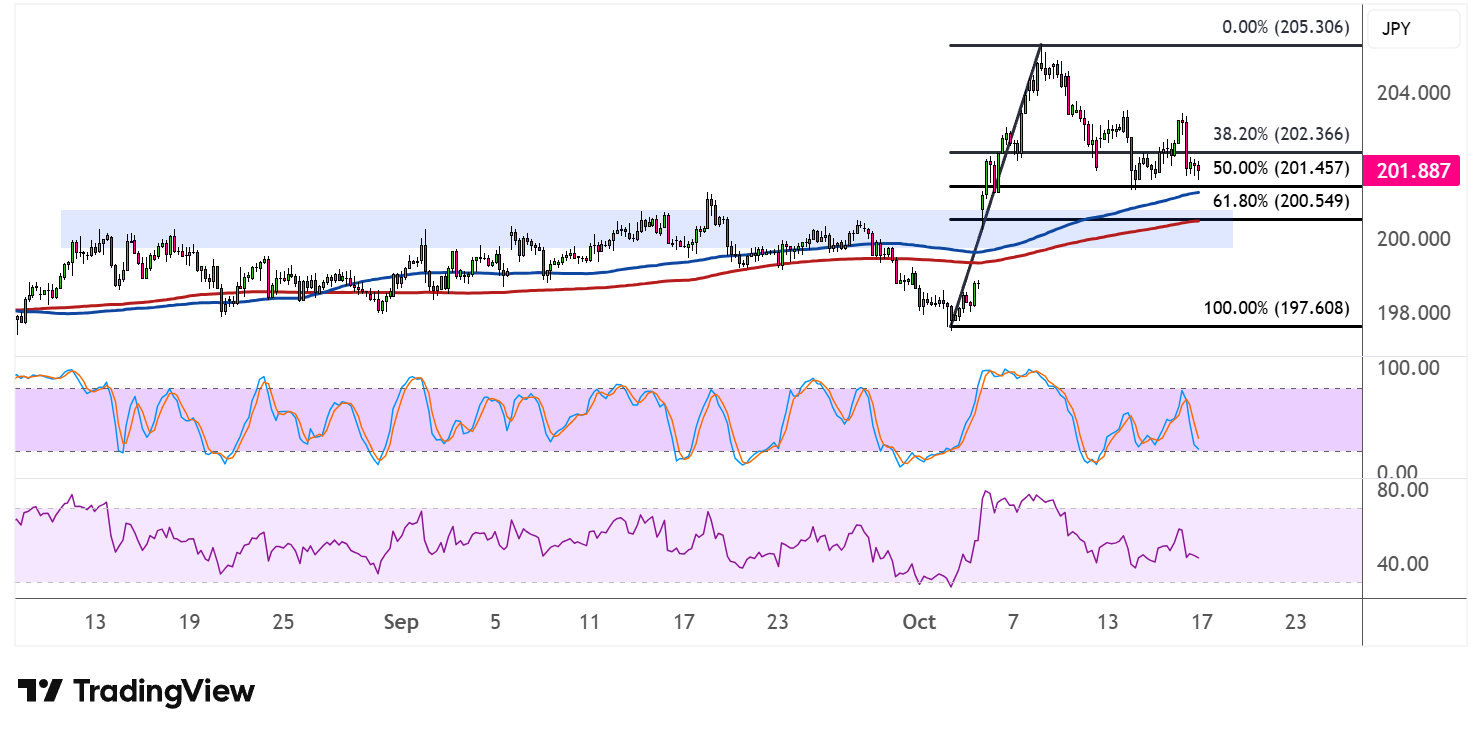
The 100 SMA (blue line) is above the 200 SMA (red line) to confirm that the path of least resistance is to the upside or that the climb is more likely to gain traction from here. Both indicators are sloping upward and could provide dynamic support on any dips, with the 200 SMA currently near the 200.000 level.
Stochastic is heading south from elevated levels, though, so a pullback could still materialize before the uptrend resumes. The oscillator has room to slide before reaching oversold territory, which means the correction could extend toward the lower Fibonacci levels.
RSI is hovering around the 50 midpoint after retreating from overbought conditions, suggesting a consolidation phase. The indicator has plenty of room to climb again before reaching overbought levels, potentially supporting further upside momentum once buyers return.