
On Friday, the gold price continued to trade around the $4,000 level after finding strong resistance in its latest attempt at a rebound. The XAU/USD trades within a sideways channel formation in the 60-minute chart.
Friday’s slight rebound pushed the price of the yellow metal slightly above the 100-hour moving average line. However, it still has room left to run before reaching the overbought levels of the 14-hour RSI.
Gold Price Fundamentals Overview

From a fundamental perspective, the XAU/USD trades during a relatively busy period in the U.S. market. On Friday, the preliminary Michigan Consumer Sentiment Index for November missed the expectation of 53.2, with a reading of 50.3. On Wednesday, the ADP Employment Change for October outperformed the expectation of 25k, with a reading of 42k, up from the previous month’s equivalent of -29k.
The ISM Services PMI for the period also came in better than expected, with 52.4 versus a forecast of 50.8, up from the preceding month’s equivalent of 50, while the S&P Global Composite PMI for the period missed the forecast of 54.8 with a reading of 54.6. The S&P Global Services PMI for the period also fell short of 55.2, with a reading of 54.8.
Earlier in the week, the ISM Global Manufacturing PMI for October came in lower than expected, with 48.7 versus a forecast of 49.5, down from the previous month’s equivalent of 49.1. The ISM Manufacturing Price Paid for the period also fell short of 61.8, with a reading of 58, while the S&P Global Manufacturing PMI beat 52.2, with a reading of 52.5.
Gold Price Technical Analysis (the 60-min Chart)
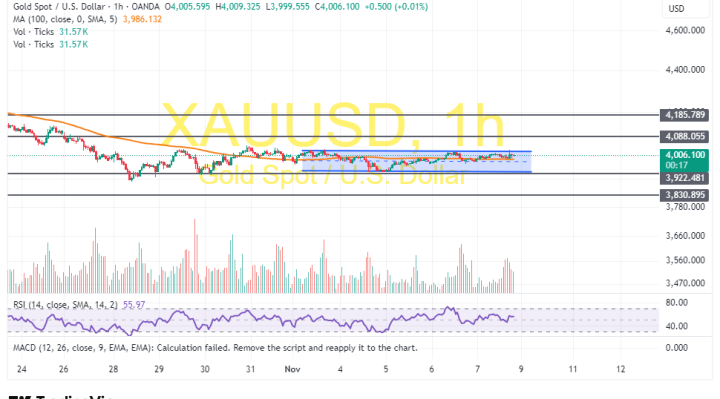
Technically, the gold price trades within a sideways channel formation in the 60-minute chart. The 14-hour RSI also trades centrally, leaving space for both the bulls and the bears to strike.
Therefore, the bears will look to pounce on potential downward movements at about $3,922 or lower at $3,830. On the other hand, the bulls will look to pounce on upward movements at about $4,088 or higher at $4,185.
Gold Price Technical Analysis (the Daily Chart)
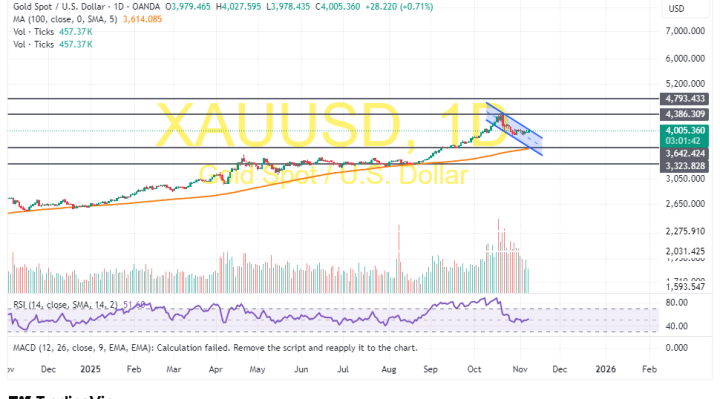
In the daily chart, the price of the yellow metal trades within a descending channel formation. The 14-day RSI also supports a long-term bearish bias after pulling back to recover from overbought conditions.
Therefore, the bears will look to stretch the current pullback towards $3,642 or lower to $3,323. On the other hand, the bulls will look to pounce on rebounds at about $4,386 or higher at $4,793.