
On Friday, the gold price pulled back from the session highs of about $4,353 to trade at about $4,255, before bouncing back to $4,299. The XAU/USD trades within an ascending channel formation in the 60-minute chart.
The price of the yellow metal continues to oscillate a few levels above the 100-hour moving average line, despite the pullback. As a result, it still has room left to run before reaching the oversold levels of the 14-hour RSI.
Gold Price Fundamentals Overview

From a fundamental perspective, the gold price trades during a relatively busy period in the U.S. market. On Thursday, the initial jobless claims for last week increased to 236k, up from 192k in the preceding week, missing the forecasted claim count of 220k. On the other hand, the continuing claims for the four weeks ending last week fell to 1.838 million, down from 1.937 million, beating the forecasted claim count of 1.95 million.
Elsewhere, U.S. wholesale inventories for September missed the forecasted change of 0.1%, with a change of 0.5%. The goods and services trade balance for the month came in better than expected, with $-52.8 versus a forecast of $-63.3, up from $-59.3 in August.
Earlier in the week, the Federal Reserve lowered the base interest rate by 25 basis points to 3.75%, down from 4%, in line with expectations. Projections for one year, two years, and three years were also unchanged at 3.4%, 3.1%, and 3.1%, respectively. The forecast for the current year also remained pinned at 3.6%, while the long-term forecast is also unchanged at 3%.
Gold Price Technical Analysis (the 60-min Chart)
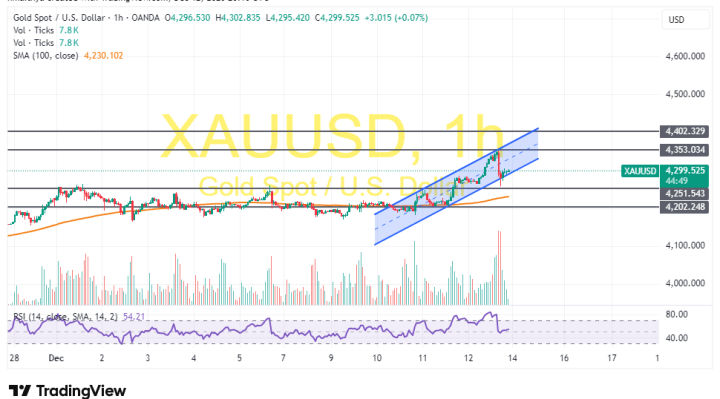
Technically, the price of the yellow metal trades within an ascending channel formation in the 60-minute chart. However, the 14-hour RSI has recently pulled back to recover from oversold conditions.
Therefore, the bears will look to extend the latest pullback towards $4,251 or lower to $4,202. On the other hand, the bulls will look to pounce on profits at about $4,353 or higher at $4,402.
Gold Price Technical Analysis (the Daily Chart)
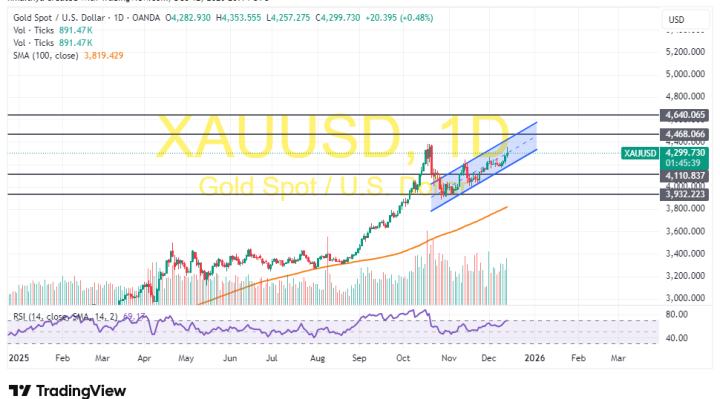
In the daily chart, the gold price trades within an ascending channel formation. The 14-day RSI also supports a long-term bullish bias as it advances towards overbought conditions.
Therefore, the bulls will look to stretch the current rally towards $4,468 or higher to $4,640. On the other hand, the bears will look to pounce on pullbacks at about $4,110 or lower at $3,932.