
GBP/USD has been carving out a descending triangle pattern on the short-term time frame, with price printing a series of lower highs connected by a falling resistance trendline while finding support around the 1.3500 horizontal floor.
The pair is currently testing this critical support zone, putting traders on alert for either a bounce or a decisive breakdown. If the 1.3500 level manages to hold as a floor, GBP/USD could stage a recovery back toward the falling trendline resistance, which is currently converging near the 1.3600 area.

A stronger bounce could extend gains toward the 1.3700 level, where the pair encountered significant selling pressure earlier in February. On the other hand, a confirmed break below the 1.3500 support could set off a sharper decline, with the measured move from the descending triangle pointing to potential losses toward the 1.3400 handle or lower.
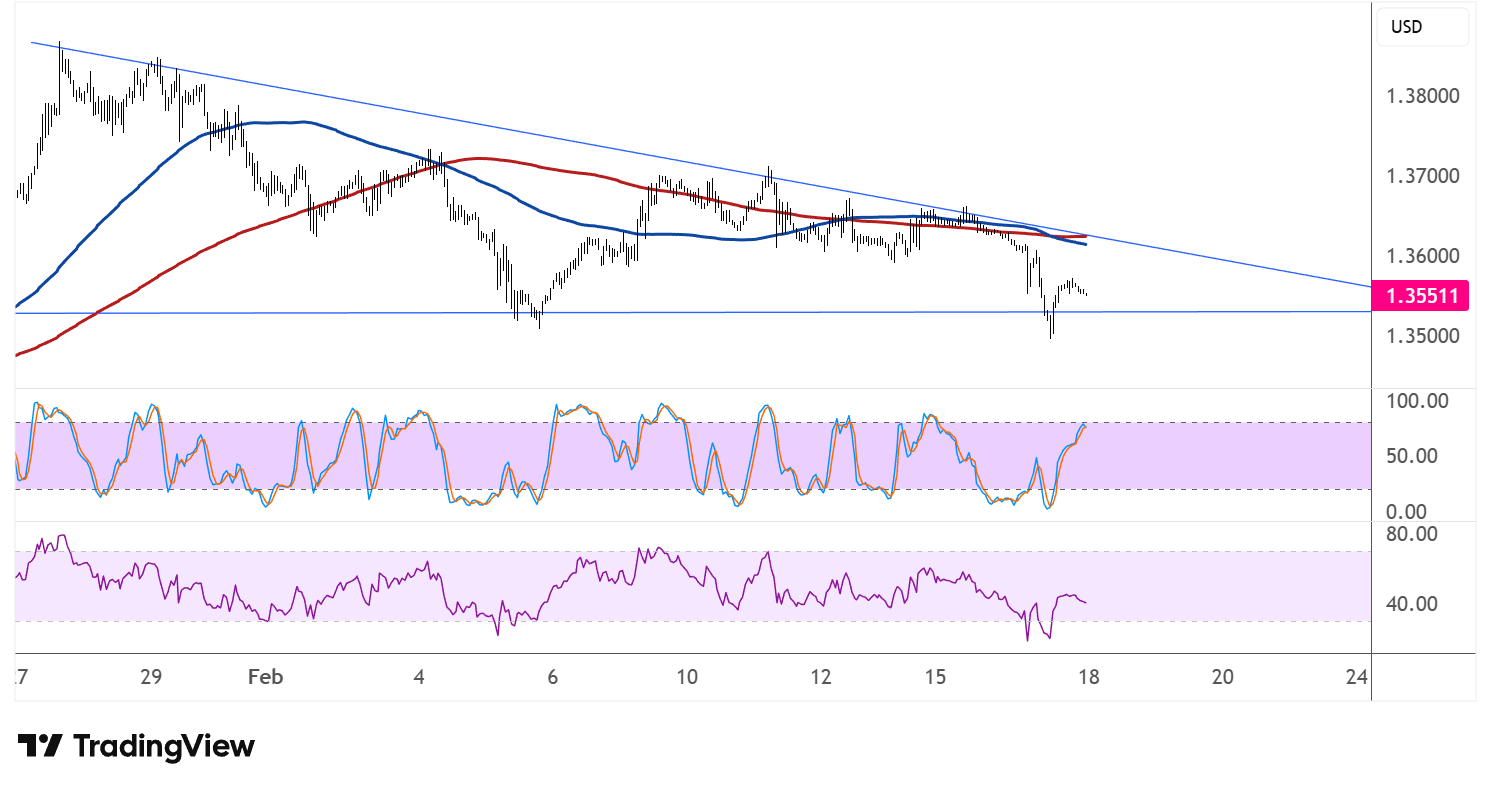
The 100 SMA (blue) has crossed below the 200 SMA (red), confirming that the path of least resistance is to the downside and that the selloff is more likely to gain traction than to reverse. Both moving averages are sloping lower and converging near the 1.3600 region, reinforcing this area as a dynamic resistance zone on any attempted recovery.
Stochastic has just crossed back up from the oversold area, signaling a potential return of buying interest that could support a short-term bounce from current levels. However, the oscillator has plenty of room to climb before reaching overbought territory, leaving the door open for price to extend its recovery if buyers follow through.
RSI, meanwhile, has bounced from near the 30 level and appears to be turning higher, suggesting that the recent selling pressure may be easing. Still, the oscillator remains below the midpoint, so bears have not entirely lost the upper hand.
Downbeat UK jobs data spurred a sharp GBP selloff in the earlier trading sessions, though traders are still waiting on the upcoming CPI release to gauge implications for BOE policy trajectory.