
Wall Street Slides as Oil Surge and Iran Tensions Shake Risk Sentiment
U.S. equities declined sharply during today’s session as geopolitical tensions intensified following reports of escalating conflict involving Iran, while crude oil prices surged above the $80 level. The spike in energy prices raised renewed concerns about inflation pressures returning to the market, which weighed heavily on overall risk sentiment.
The Dow Jones Industrial Average dropped 1,059.55 points (-2.17%) to 47,679.86. The S&P 500 declined 85.43 points (-1.24%) to 6,784.07, while the Nasdaq Composite fell 245.83 points (-1.08%) to 22,561.66.

Rising oil prices and geopolitical uncertainty have become the main drivers behind the current market weakness. Investors are reducing exposure to risk assets as volatility increases across global markets. Traders are now watching closely whether the sell-off represents a deeper corrective phase or simply a temporary pullback within the broader bullish market structure.
Dow Jones Industrial Average (INDU)
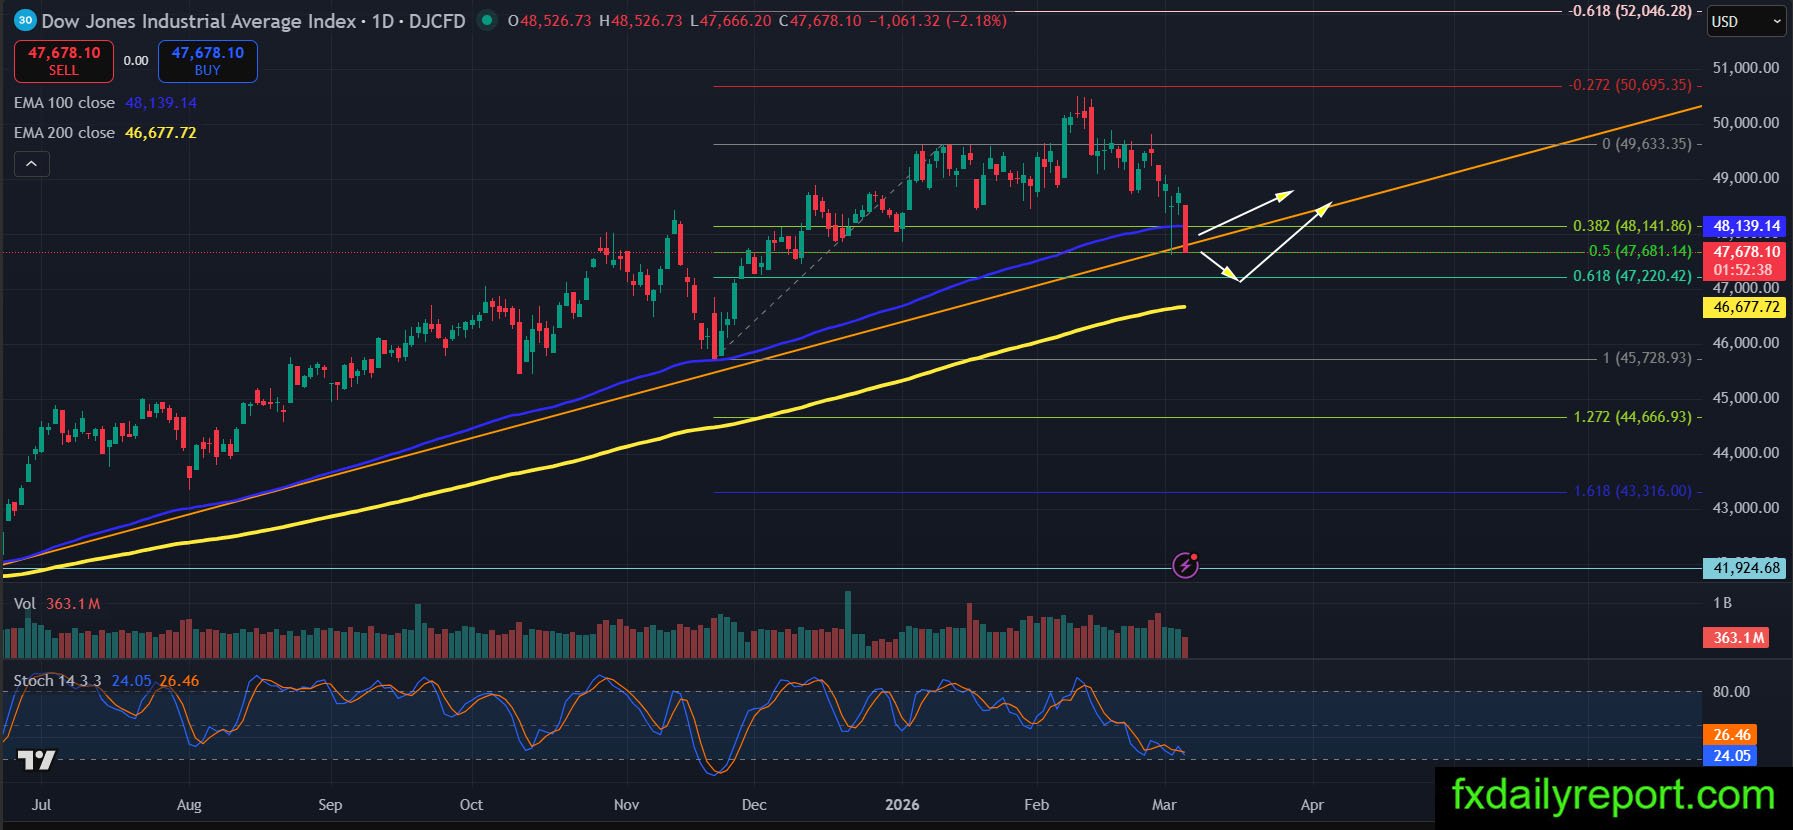
The DJIA rolled lower with strong bearish momentum, dropping more than 1,000 points and pushing the index toward the rising trend line that has supported the broader uptrend. This trend line now becomes a critical technical level. If the index manages to stabilize above the trend line, a rebound toward the 48,100–48,600 area could develop. However, if the trend line breaks decisively, the bearish momentum may extend further. In that scenario, the next downside targets would appear near the 47,000 level or the EMA 200. For now, traders will closely observe the reaction around the trend line to determine whether the move develops into a deeper correction.
McDonald’s Corporation (MCD)
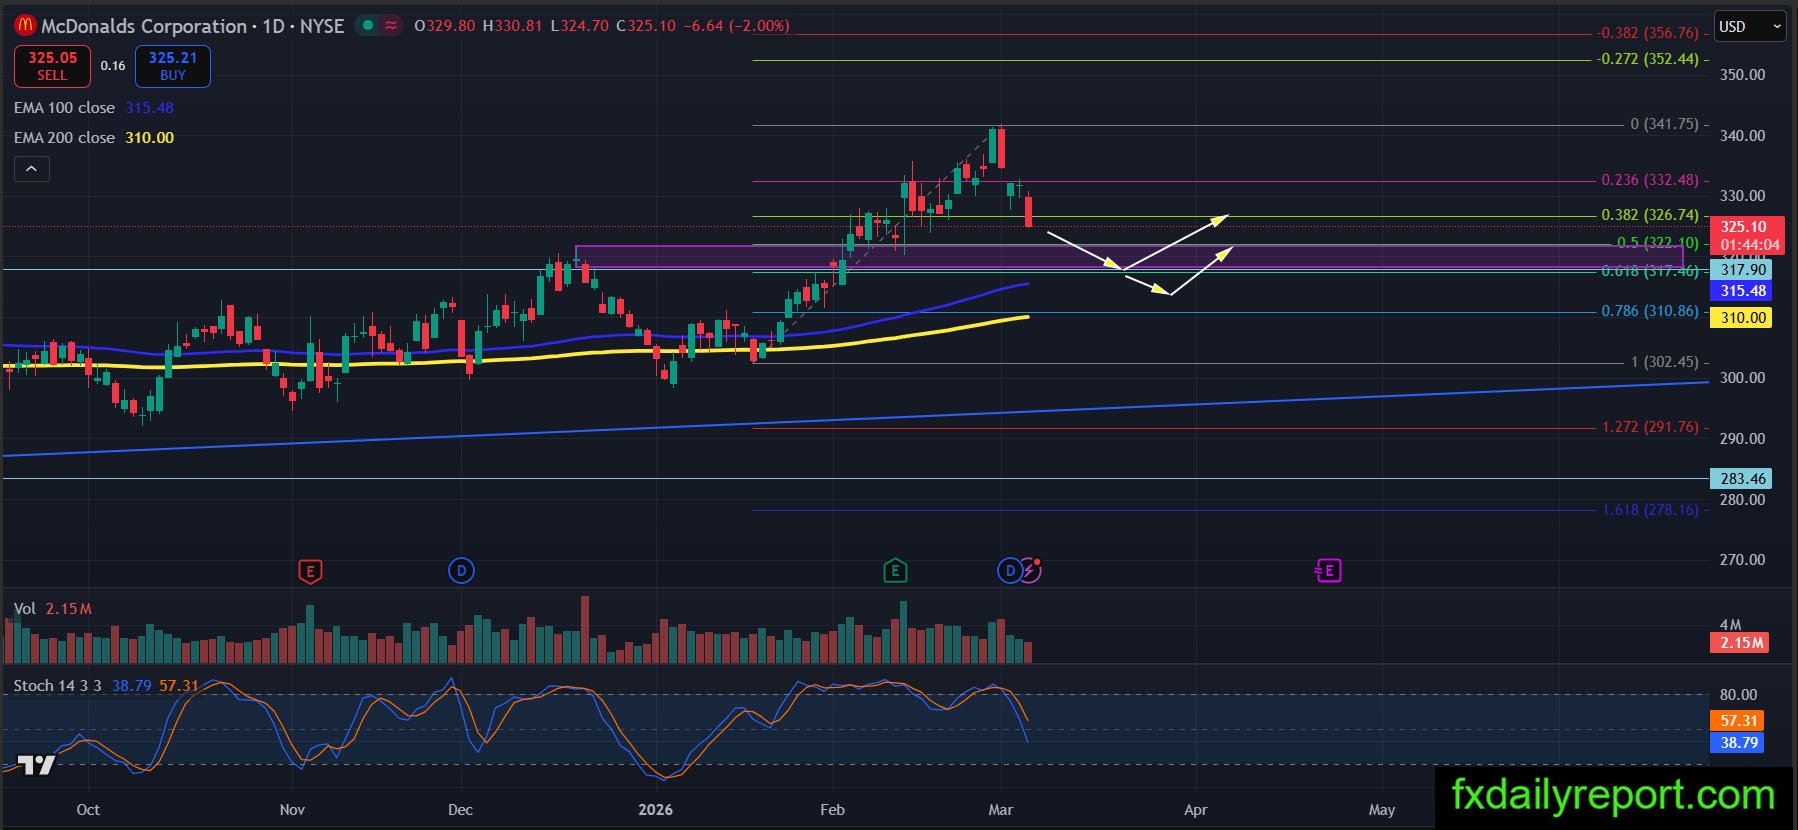
MCD is currently trading lower following the broader market weakness. Despite the pullback, the stock previously broke above its swing high, which keeps the broader structure constructive. Price is now approaching a confluence support area formed by Fibonacci retracement levels and prior structure support. This area could attract buyers if the stock begins to stabilize. If price holds within the support zone and shows signs of recovery, the stock could start another bullish leg to target previous swing high. However, failure to hold the support area would open the door for further downside toward the $310.00 area near the daily SMA 200.