
WTI crude oil is pulling back to a key area of interest after failing to sustain its climb past the $110.81 swing high, as the commodity retraces inside its ascending channel on the short-term time frame.
Price appears to be drawing closer to the rising trend line support, which has been guiding the series of higher lows since mid-April.

A bounce off this floor could set the stage for another run toward the $110.81 area of interest and potentially beyond. The Fibonacci retracement tool highlights where buyers could be waiting to jump back in on the dip.
The 38.2% Fib level is at $103.82, which price is currently hovering around. A deeper correction could reach the 50% level at $101.66, which lines up with the ascending trend line and could attract more bullish attention.
A larger pullback could still extend to the 61.8% Fib at $99.50, which could be the line in the sand for a bullish retracement before the uptrend resumes. Below that, the 100% level at $92.51 marks the swing low of the measured move.
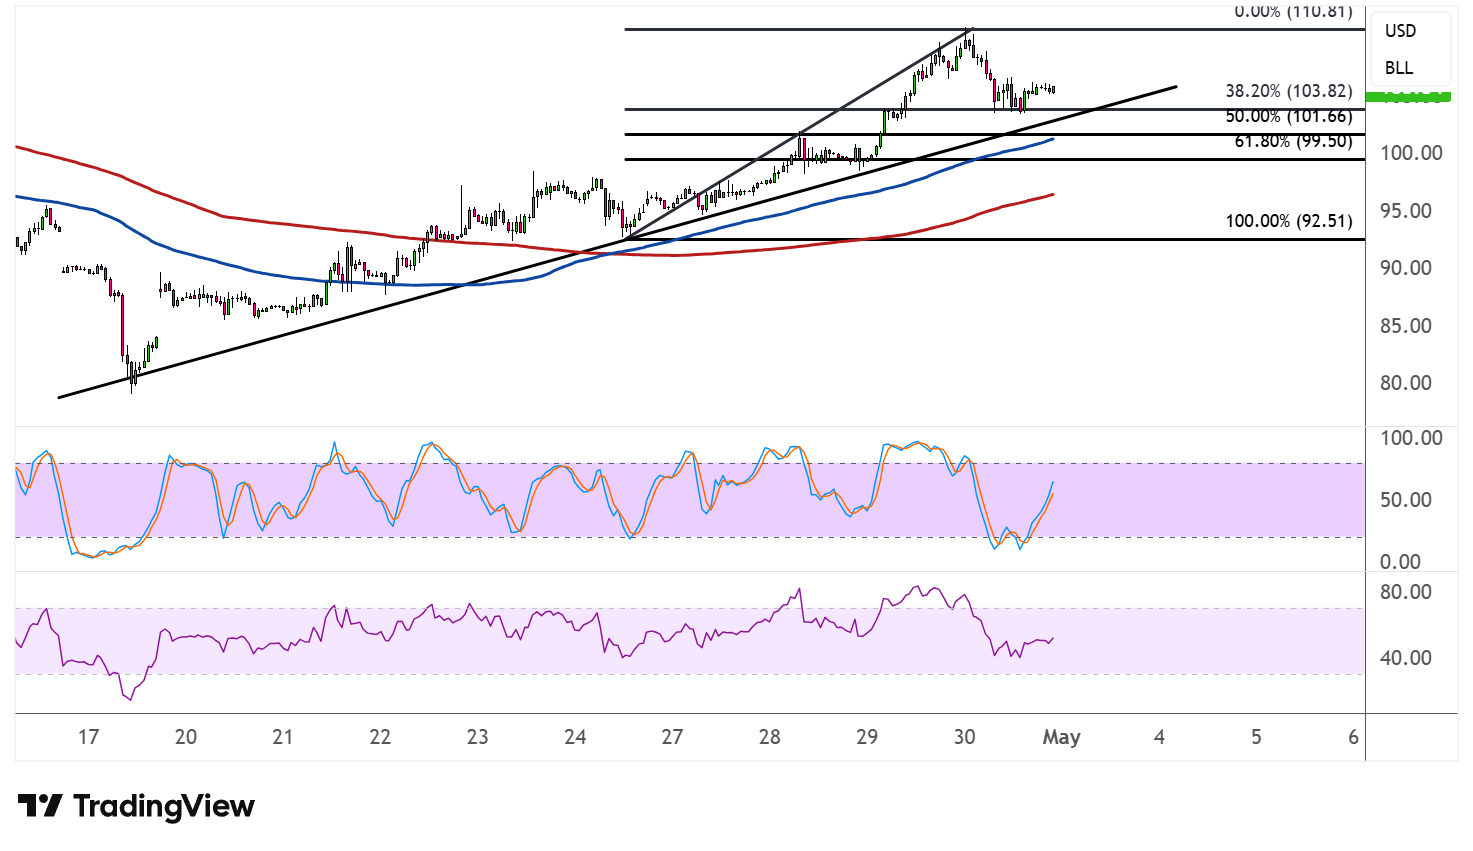
On the moving averages front, the 100 SMA is above the 200 SMA to confirm that the path of least resistance is to the upside or that the broader uptrend still has legs. Price is trading in the vicinity of both indicators, so these dynamic levels could act as added support on the current dip.
Stochastic has dipped into the oversold area and appears to be turning higher, suggesting that sellers are running out of steam and buyers could be gearing up to return. A bullish crossover from this region would add conviction to a bounce off the Fib levels.
RSI is also hovering near the lower end of its range, leaving room for buyers to push price higher without hitting overbought conditions too quickly.